| Zacks Company Profile for Aquestive Therapeutics, Inc. (AQST : NSDQ) |
|
|
| |
| • Company Description |
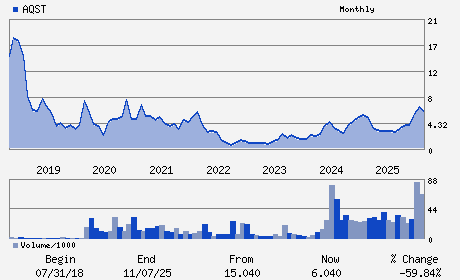
| Aquestive Therapeutics, Inc. is a specialty pharmaceutical company. It commercializes medicines to solve critical health care problems as well as engages on late-stage proprietary product pipeline which focuses on the treatment of diseases of central nervous system. Aquestive Therapeutics, Inc. is based in NJ, United States.
Number of Employees: 142 |
|
|
| |
| • Price / Volume Information |
| Yesterday's Closing Price: $3.65 |
Daily Weekly Monthly
 |
| 20 Day Moving Average: 6,385,347 shares |
| Shares Outstanding: 122.00 (millions) |
| Market Capitalization: $445.31 (millions) |
| Beta: 1.65 |
| 52 Week High: $7.55 |
| 52 Week Low: $2.12 |
| Short Interest Ratio: |
| |
% Price Change |
% Price Change Relative to S&P 500 |
| 4 Week |
10.27% |
11.95% |
| 12 Week |
-36.19% |
-38.37% |
| Year To Date |
-43.50% |
-43.42% |
|
|
|
|
| |
|
|
| |
| • General Corporate Information |
Officers
Daniel Barber - President and Chief Executive Officer
Gregory B. Brown - Chairman
A. Ernest Toth, Jr. - Senior Vice President; Chief Financial Officer
Abigail L. Jenkins - Director
John S. Cochran - Director
|
|
Peer Information
Aquestive Therapeutics, Inc. (GSAC)
Aquestive Therapeutics, Inc. (CASI)
Aquestive Therapeutics, Inc. (ALCD.)
Aquestive Therapeutics, Inc. (OMNN)
Aquestive Therapeutics, Inc. (CGPI.)
Aquestive Therapeutics, Inc. (CATX)
|
|
Industry / Sector / Ticker Info
Analyst Coverage: No
Industry Group: MED-DRUGS
Sector: Medical
CUSIP: 03843E104
SIC: 2834
|
|
Fiscal Year
Fiscal Year End: December
Last Reported Quarter: 09/01/25
Next Expected EPS Date: 03/04/26
|
|
Share - Related Items
Shares Outstanding: 122.00
Most Recent Split Date: (:1)
Beta: 1.65
Market Capitalization: $445.31 (millions)
|
|
|
|
|
| |
| • EPS Information |
• Dividend Information |
| Analyst Coverage: No |
Dividend Yield: 0.00% |
| Current Fiscal Quarter EPS Consensus Estimate: $-0.15 |
Indicated Annual Dividend: $0.00 |
| Current Fiscal Year EPS Consensus Estimate: $-0.56 |
Payout Ratio: |
| Number of Estimates in the Fiscal Year Consensus: 6.00 |
Change In Payout Ratio: |
| Estmated Long-Term EPS Growth Rate: % |
Last Dividend Paid: NA - $0.00 |
| Next EPS Report Date: 03/04/26 |
|
|
|
| |