| Zacks Company Profile for Astrana Health, Inc. (ASTH : NSDQ) |
|
|
| |
| • Company Description |
| Astrana Health is a provider-centric, technology-powered healthcare company. It operates an integrated healthcare delivery platform which enables providers to participate in value-based care arrangements. Astrana Health, formerly known as Apollo Medical Holdings Inc., is based in ALHAMBRA, Calif.
Number of Employees: 1,900 |
|
|
| |
| • Price / Volume Information |
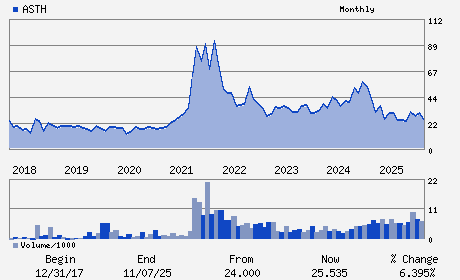
| Yesterday's Closing Price: $18.16 |
Daily Weekly Monthly
 |
| 20 Day Moving Average: 601,871 shares |
| Shares Outstanding: 56.29 (millions) |
| Market Capitalization: $1,022.20 (millions) |
| Beta: 0.90 |
| 52 Week High: $39.97 |
| 52 Week Low: $18.08 |
| Short Interest Ratio: |
| |
% Price Change |
% Price Change Relative to S&P 500 |
| 4 Week |
-33.67% |
-32.59% |
| 12 Week |
-10.72% |
-14.56% |
| Year To Date |
-26.80% |
-26.67% |
|
|
|
|
| |
|
|
| |
| • General Corporate Information |
Officers
Brandon K. Sim - Chief Executive Officer and President
Kenneth Sim - Executive Chairman; Director
Thomas Lam - Vice Chairman; Director
Chandan Basho - Chief Financial and Operating Officer
John Vong - Chief Accounting Officer
|
|
Peer Information
Astrana Health, Inc. (CMTI)
Astrana Health, Inc. (CMWLQ)
Astrana Health, Inc. (AHG.)
Astrana Health, Inc. (ROIX)
Astrana Health, Inc. (M.DCE)
Astrana Health, Inc. (DHSM)
|
|
Industry / Sector / Ticker Info
Analyst Coverage: No
Industry Group: MED-OUTP/HM CRE
Sector: Medical
CUSIP: 03763A207
SIC: 8742
|
|
Fiscal Year
Fiscal Year End: December
Last Reported Quarter: 09/01/25
Next Expected EPS Date: 03/02/26
|
|
Share - Related Items
Shares Outstanding: 56.29
Most Recent Split Date: (:1)
Beta: 0.90
Market Capitalization: $1,022.20 (millions)
|
|
|
|
|
| |
| • EPS Information |
• Dividend Information |
| Analyst Coverage: No |
Dividend Yield: 0.00% |
| Current Fiscal Quarter EPS Consensus Estimate: $0.20 |
Indicated Annual Dividend: $0.00 |
| Current Fiscal Year EPS Consensus Estimate: $1.00 |
Payout Ratio: 0.00 |
| Number of Estimates in the Fiscal Year Consensus: 3.00 |
Change In Payout Ratio: 0.00 |
| Estmated Long-Term EPS Growth Rate: 33.66% |
Last Dividend Paid: NA - $0.00 |
| Next EPS Report Date: 03/02/26 |
|
|
|
| |