| Zacks Company Profile for Bath & Body Works, Inc. (BBWI : NYSE) |
|
|
| |
| • Company Description |
| Bath & Body Works is a specialty retailers and home to America's Favorite Fragrances(R) offering exclusive fragrances for the body and home, fragrance mist, body lotion and body cream, 3-wick candles, home fragrance diffusers and liquid hand soap. Bath & Body Works, formerly known as L BRANDS INC, is based in COLUMBUS, Ohio.
Number of Employees: 59,210 |
|
|
| |
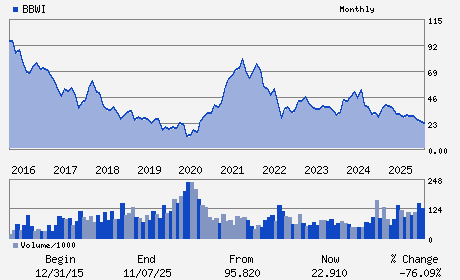
| • Price / Volume Information |
| Yesterday's Closing Price: $24.07 |
Daily Weekly Monthly
 |
| 20 Day Moving Average: 4,212,175 shares |
| Shares Outstanding: 204.72 (millions) |
| Market Capitalization: $4,927.65 (millions) |
| Beta: 1.54 |
| 52 Week High: $41.87 |
| 52 Week Low: $14.28 |
| Short Interest Ratio: |
| |
% Price Change |
% Price Change Relative to S&P 500 |
| 4 Week |
3.44% |
5.01% |
| 12 Week |
62.09% |
56.56% |
| Year To Date |
19.87% |
20.03% |
|
|
|
|
| |
|
|
| |
| • General Corporate Information |
Officers
Gina R. Boswell - Chief Executive Officer
Sarah E. Nash - Chairman
Eva C. Boratto - Chief Financial Officer
Alessandro Bogliolo - Director
Lucy O. Brady - Director
|
|
Peer Information
Bath & Body Works, Inc. (COCQ)
Bath & Body Works, Inc. (JAS)
Bath & Body Works, Inc. (JAS.B)
Bath & Body Works, Inc. (HKFIQ)
Bath & Body Works, Inc. (CNJ)
Bath & Body Works, Inc. (T.CTC)
|
|
Industry / Sector / Ticker Info
Analyst Coverage: No
Industry Group: RETAIL-MISC/DIV
Sector: Retail/Wholesale
CUSIP: 070830104
SIC: 5990
|
|
Fiscal Year
Fiscal Year End: January
Last Reported Quarter: 10/01/25
Next Expected EPS Date: 02/26/26
|
|
Share - Related Items
Shares Outstanding: 204.72
Most Recent Split Date: 5.00 (2.00:1)
Beta: 1.54
Market Capitalization: $4,927.65 (millions)
|
|
|
|
|
| |
| • EPS Information |
• Dividend Information |
| Analyst Coverage: No |
Dividend Yield: 3.32% |
| Current Fiscal Quarter EPS Consensus Estimate: $0.31 |
Indicated Annual Dividend: $0.80 |
| Current Fiscal Year EPS Consensus Estimate: $2.43 |
Payout Ratio: 0.24 |
| Number of Estimates in the Fiscal Year Consensus: 7.00 |
Change In Payout Ratio: 0.05 |
| Estmated Long-Term EPS Growth Rate: 9.32% |
Last Dividend Paid: 11/21/2025 - $0.20 |
| Next EPS Report Date: 02/26/26 |
|
|
|
| |