| Zacks Company Profile for Beeline Holdings, Inc. (BLNE : NSDQ) |
|
|
| |
| • Company Description |
| Beeline Financial Holdings Inc. is a technology-driven mortgage lender and title provider building a fully digital, AI-powered platform that simplifies and accelerates the home financing process. Beeline Financial Holdings Inc., formerly known as Eastside Distilling Inc., is headquartered in Providence, RI.
Number of Employees: 76 |
|
|
| |
| • Price / Volume Information |
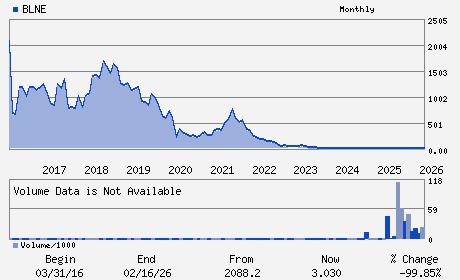
| Yesterday's Closing Price: $3.03 |
Daily Weekly Monthly
 |
| 20 Day Moving Average: 1,190,514 shares |
| Shares Outstanding: 27.75 (millions) |
| Market Capitalization: $84.10 (millions) |
| Beta: 1.65 |
| 52 Week High: $8.40 |
| 52 Week Low: $0.62 |
| Short Interest Ratio: |
| |
% Price Change |
% Price Change Relative to S&P 500 |
| 4 Week |
-1.30% |
0.20% |
| 12 Week |
99.34% |
92.54% |
| Year To Date |
76.16% |
76.40% |
|
|
|
|
| |
|
|
| |
| • General Corporate Information |
Officers
Nicholas R. Liuzza - Chief Executive Officer
Christopher R. Moe - Chief Financial Officer
Joseph Caltabiano - Director
Eric Finnsson - Director
Joseph Freedman - Director
|
|
Peer Information
Beeline Holdings, Inc. (EIIN)
Beeline Holdings, Inc. (AFMI)
Beeline Holdings, Inc. (DRL)
Beeline Holdings, Inc. (GRFPY)
Beeline Holdings, Inc. (IGOT)
Beeline Holdings, Inc. (ATLC)
|
|
Industry / Sector / Ticker Info
Analyst Coverage: No
Industry Group: FIN-MISC SVCS
Sector: Finance
CUSIP: 277802500
SIC: 6162
|
|
Fiscal Year
Fiscal Year End: December
Last Reported Quarter: 09/01/25
Next Expected EPS Date: 03/30/26
|
|
Share - Related Items
Shares Outstanding: 27.75
Most Recent Split Date: 3.00 (0.10:1)
Beta: 1.65
Market Capitalization: $84.10 (millions)
|
|
|
|
|
| |
| • EPS Information |
• Dividend Information |
| Analyst Coverage: No |
Dividend Yield: 0.00% |
| Current Fiscal Quarter EPS Consensus Estimate: $ |
Indicated Annual Dividend: $0.00 |
| Current Fiscal Year EPS Consensus Estimate: $-0.01 |
Payout Ratio: |
| Number of Estimates in the Fiscal Year Consensus: 1.00 |
Change In Payout Ratio: |
| Estmated Long-Term EPS Growth Rate: % |
Last Dividend Paid: NA - $0.00 |
| Next EPS Report Date: 03/30/26 |
|
|
|
| |