| Zacks Company Profile for Burberry Group PLC (BURBY : OTC) |
|
|
| |
| • Company Description |
| Burberry Group plc is engaged in the designing, sourcing, manufacturing and marketing of luxury clothing and non-apparel accessories. The Company's products include outerwear, fragrance and beauty products, eyewear, watches, trench coats, small leather goods, handbags, totes and mufflers, scarves, shoes, belts and jewellery. It sells through a diversified network of retail, digital, wholesale and licensing channels worldwide. Burberry Group plc is headquartered in London, the United Kingdom.
Number of Employees: 8,459 |
|
|
| |
| • Price / Volume Information |
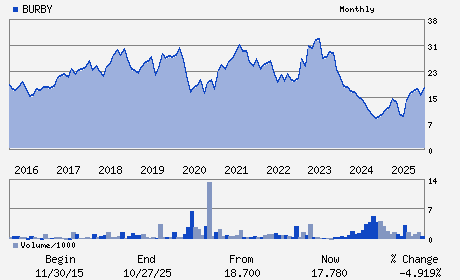
| Yesterday's Closing Price: $16.29 |
Daily Weekly Monthly
 |
| 20 Day Moving Average: 60,780 shares |
| Shares Outstanding: 360.99 (millions) |
| Market Capitalization: $5,880.59 (millions) |
| Beta: 1.14 |
| 52 Week High: $18.55 |
| 52 Week Low: $8.00 |
| Short Interest Ratio: |
| |
% Price Change |
% Price Change Relative to S&P 500 |
| 4 Week |
-4.74% |
-3.29% |
| 12 Week |
9.18% |
5.46% |
| Year To Date |
-4.40% |
-4.27% |
|
|
|
|
| |
|
|
| |
| • General Corporate Information |
Officers
Joshua Schulman - Chief Executive Officer
Gerry Murphy - Chairman
Kate Ferry - Chief Financial Officer
Gemma Parsons - Company Secretary
Orna NiChionna - Director
|
|
Peer Information
Burberry Group PLC (CACH)
Burberry Group PLC (DXLG)
Burberry Group PLC (HIBB)
Burberry Group PLC (WALKQ)
Burberry Group PLC (BDST)
Burberry Group PLC (CBKCQ)
|
|
Industry / Sector / Ticker Info
Analyst Coverage: No
Industry Group: RETAIL-APP/SHOE
Sector: Retail/Wholesale
CUSIP: 12082W204
SIC: 8880
|
|
Fiscal Year
Fiscal Year End: March
Last Reported Quarter: -
Next Expected EPS Date: -
|
|
Share - Related Items
Shares Outstanding: 360.99
Most Recent Split Date: 2.00 (2.00:1)
Beta: 1.14
Market Capitalization: $5,880.59 (millions)
|
|
|
|
|
| |
| • EPS Information |
• Dividend Information |
| Analyst Coverage: No |
Dividend Yield: 0.00% |
| Current Fiscal Quarter EPS Consensus Estimate: $0.27 |
Indicated Annual Dividend: $0.00 |
| Current Fiscal Year EPS Consensus Estimate: $0.28 |
Payout Ratio: |
| Number of Estimates in the Fiscal Year Consensus: 3.00 |
Change In Payout Ratio: |
| Estmated Long-Term EPS Growth Rate: % |
Last Dividend Paid: NA - $0.00 |
| Next EPS Report Date: - |
|
|
|
| |