| Zacks Company Profile for CBL & Associates Properties, Inc. (CBLAQ : OTC) |
|
|
| |
| • Company Description |
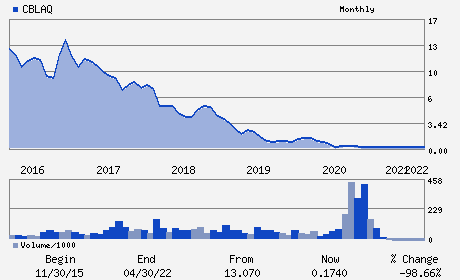
| CBL & Associates Properties, Inc. is a fully integrated real estate investment trust which owns, develops, acquires, leases, manages, and operates regional shopping malls, open-air centers, community centers and office properties. The Company conducts substantially all of its business through its operating partnership. It owns two qualified REIT subsidiaries: CBL Holdings I, Inc. and CBL Holdings II, Inc. CBL & Associates Properties is headquartered in Chattanooga, Tennessee.
Number of Employees: 477 |
|
|
| |
| • Price / Volume Information |
| Yesterday's Closing Price: $ |
Daily Weekly Monthly
 |
| 20 Day Moving Average: shares |
| Shares Outstanding: (millions) |
| Market Capitalization: $ (millions) |
| Beta: |
| 52 Week High: $0.20 |
| 52 Week Low: $0.09 |
| Short Interest Ratio: |
| |
% Price Change |
% Price Change Relative to S&P 500 |
| 4 Week |
% |
% |
| 12 Week |
% |
% |
| Year To Date |
% |
% |
|
|
|
|
| |
|
|
| |
| • General Corporate Information |
Officers
Stephen D. Lebovitz - Chief Executive Officer
Stephen D. Lebovitz - Chief Executive Officer;Director
David J. Contis - Chairman of the Board
David J. Contis - Chairman of the Board
Benjamin W. Jaenicke - Executive Vice President - Chief Financial Officer
|
|
Peer Information
CBL & Associates Properties, Inc. (FRT)
CBL & Associates Properties, Inc. (PECO)
CBL & Associates Properties, Inc. (EQY)
CBL & Associates Properties, Inc. (SITC)
CBL & Associates Properties, Inc. (BFS)
CBL & Associates Properties, Inc. (ADC)
|
|
Industry / Sector / Ticker Info
Analyst Coverage: No
Industry Group: REIT-EQTY TRUST - RETAIL
Sector: Finance
CUSIP: 124830100
SIC: 6798
|
|
Fiscal Year
Fiscal Year End: December
Last Reported Quarter: 06/01/25
Next Expected EPS Date: 02/13/26
|
|
Share - Related Items
Shares Outstanding:
Most Recent Split Date: 6.00 (2.00:1)
Beta:
Market Capitalization: $ (millions)
|
|
|
|
|
| |
| • EPS Information |
• Dividend Information |
| Analyst Coverage: No |
Dividend Yield: % |
| Current Fiscal Quarter EPS Consensus Estimate: $ |
Indicated Annual Dividend: $0.00 |
| Current Fiscal Year EPS Consensus Estimate: $ |
Payout Ratio: |
| Number of Estimates in the Fiscal Year Consensus: |
Change In Payout Ratio: |
| Estmated Long-Term EPS Growth Rate: % |
Last Dividend Paid: NA - $0.00 |
| Next EPS Report Date: 02/13/26 |
|
|
|
| |