| Zacks Company Profile for ChargePoint Holdings, Inc. (CHPT : NYSE) |
|
|
| |
| • Company Description |
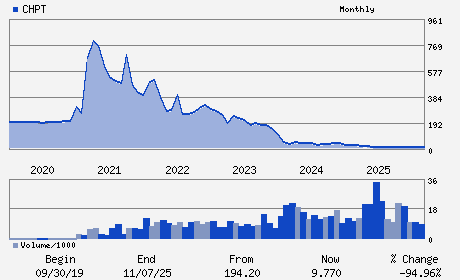
| ChargePoint Holdings Inc. provides electric vehicle charging network. The company's cloud subscription platform and software-defined charging hardware are designed to include options for every charging scenario from home and multifamily to workplace, parking, hospitality, retail and transport fleets of all types. ChargePoint Holdings Inc., formerly known as Switchback Energy Acquisition Corporation, is based in CAMPBELL, Calif.
Number of Employees: 1,395 |
|
|
| |
| • Price / Volume Information |
| Yesterday's Closing Price: $5.90 |
Daily Weekly Monthly
 |
| 20 Day Moving Average: 552,991 shares |
| Shares Outstanding: 23.65 (millions) |
| Market Capitalization: $139.55 (millions) |
| Beta: 1.40 |
| 52 Week High: $17.78 |
| 52 Week Low: $5.53 |
| Short Interest Ratio: |
| |
% Price Change |
% Price Change Relative to S&P 500 |
| 4 Week |
-15.47% |
-14.19% |
| 12 Week |
-24.94% |
-27.50% |
| Year To Date |
-11.15% |
-11.02% |
|
|
|
|
| |
|
|
| |
| • General Corporate Information |
Officers
Rick Wilmer - Chief Executive Officer and Director
Mansi Khetani - Chief Financial Officer; Principal Financial Offic
Roxanne Bowman - Director
Elaine L. Chao - Director
Bruce Chizen - Director
|
|
Peer Information
ChargePoint Holdings, Inc. (M.BUD)
ChargePoint Holdings, Inc. (DCNAQ)
ChargePoint Holdings, Inc. (CGUL)
ChargePoint Holdings, Inc. (DAN)
ChargePoint Holdings, Inc. (CTTAY)
ChargePoint Holdings, Inc. (M.DEC)
|
|
Industry / Sector / Ticker Info
Analyst Coverage: No
Industry Group: AUTO/TRUCK-ORIG
Sector: Auto/Tires/Trucks
CUSIP: 15961R303
SIC: 3790
|
|
Fiscal Year
Fiscal Year End: January
Last Reported Quarter: 10/01/25
Next Expected EPS Date: 03/03/26
|
|
Share - Related Items
Shares Outstanding: 23.65
Most Recent Split Date: 7.00 (0.05:1)
Beta: 1.40
Market Capitalization: $139.55 (millions)
|
|
|
|
|
| |
| • EPS Information |
• Dividend Information |
| Analyst Coverage: No |
Dividend Yield: 0.00% |
| Current Fiscal Quarter EPS Consensus Estimate: $-1.40 |
Indicated Annual Dividend: $0.00 |
| Current Fiscal Year EPS Consensus Estimate: $-6.11 |
Payout Ratio: |
| Number of Estimates in the Fiscal Year Consensus: 3.00 |
Change In Payout Ratio: |
| Estmated Long-Term EPS Growth Rate: % |
Last Dividend Paid: NA - $0.00 |
| Next EPS Report Date: 03/03/26 |
|
|
|
| |