| Zacks Company Profile for C.H. Robinson Worldwide, Inc. (CHRW : NSDQ) |
|
|
| |
| • Company Description |
| C.H. Robinson Worldwide Inc. is a third-party logistics company. As a non-asset based transportation provider, C.H. Robinson provides freight transportation services and logistic solutions to companies across a range of industries. The company's services range from commitments on a specific shipment to more comprehensive and integrated relationships.
Number of Employees: 13,781 |
|
|
| |
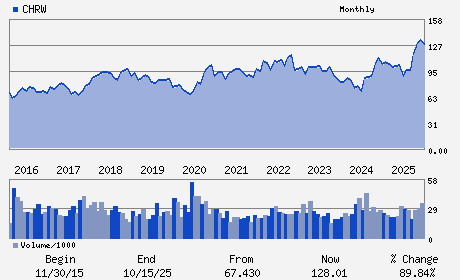
| • Price / Volume Information |
| Yesterday's Closing Price: $176.01 |
Daily Weekly Monthly
 |
| 20 Day Moving Average: 3,191,501 shares |
| Shares Outstanding: 118.14 (millions) |
| Market Capitalization: $20,793.32 (millions) |
| Beta: 0.89 |
| 52 Week High: $203.34 |
| 52 Week Low: $84.68 |
| Short Interest Ratio: |
| |
% Price Change |
% Price Change Relative to S&P 500 |
| 4 Week |
0.14% |
1.66% |
| 12 Week |
16.04% |
12.08% |
| Year To Date |
9.49% |
9.64% |
|
|
|
|
| |
|
|
| |
| • General Corporate Information |
Officers
David P. Bozeman - Chief Executive Officer
Jodee A. Kozlak - Chair of the Board
Damon J. Lee - Chief Financial Officer
Kermit R. Crawford - Director
Henry J. Maier - Director
|
|
Peer Information
C.H. Robinson Worldwide, Inc. (HKAEY)
C.H. Robinson Worldwide, Inc. (UHAL)
C.H. Robinson Worldwide, Inc. (LYNG)
C.H. Robinson Worldwide, Inc. (MATX)
C.H. Robinson Worldwide, Inc. (GLC)
C.H. Robinson Worldwide, Inc. (FAVS)
|
|
Industry / Sector / Ticker Info
Analyst Coverage: No
Industry Group: TRANS-SERVICES
Sector: Transportation
CUSIP: 12541W209
SIC: 4731
|
|
Fiscal Year
Fiscal Year End: December
Last Reported Quarter: 12/01/25
Next Expected EPS Date: 04/29/26
|
|
Share - Related Items
Shares Outstanding: 118.14
Most Recent Split Date: 10.00 (2.00:1)
Beta: 0.89
Market Capitalization: $20,793.32 (millions)
|
|
|
|
|
| |
| • EPS Information |
• Dividend Information |
| Analyst Coverage: No |
Dividend Yield: 1.43% |
| Current Fiscal Quarter EPS Consensus Estimate: $1.27 |
Indicated Annual Dividend: $2.52 |
| Current Fiscal Year EPS Consensus Estimate: $5.90 |
Payout Ratio: 0.50 |
| Number of Estimates in the Fiscal Year Consensus: 10.00 |
Change In Payout Ratio: 0.01 |
| Estmated Long-Term EPS Growth Rate: 16.09% |
Last Dividend Paid: 12/05/2025 - $0.63 |
| Next EPS Report Date: 04/29/26 |
|
|
|
| |