| Zacks Company Profile for Traeger, Inc. (COOK : NYSE) |
|
|
| |
| • Company Description |
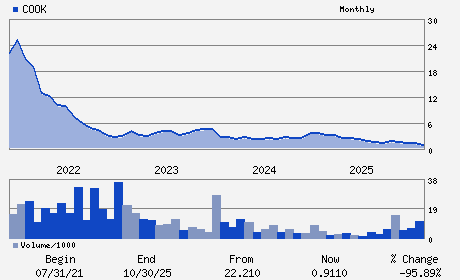
| Traeger Inc. provides wood pellet grill. The company's pellet grills utilize wood-fired convection power, owners can grill, smoke, bake, roast, braise and barbecue meals on one cooking system. Traeger Inc. is headquartered in Salt Lake City.
Number of Employees: 666 |
|
|
| |
| • Price / Volume Information |
| Yesterday's Closing Price: $0.89 |
Daily Weekly Monthly
 |
| 20 Day Moving Average: 299,032 shares |
| Shares Outstanding: 137.18 (millions) |
| Market Capitalization: $122.19 (millions) |
| Beta: 1.38 |
| 52 Week High: $2.52 |
| 52 Week Low: $0.71 |
| Short Interest Ratio: |
| |
% Price Change |
% Price Change Relative to S&P 500 |
| 4 Week |
-15.97% |
-14.64% |
| 12 Week |
16.60% |
11.53% |
| Year To Date |
-17.53% |
-20.76% |
|
|
|
|
| |
|
|
| |
| • General Corporate Information |
Officers
Jeremy Andrus - Chief Executive Officer; Chairman
Jim Hardy - President of MEATER
Dominic Blosil - Chief Financial Officer
Wendy A. Beck - Director
Martin Eltrich - Director
|
|
Peer Information
Traeger, Inc. (LENXQ)
Traeger, Inc. (BFXXQ)
Traeger, Inc. (CENT)
Traeger, Inc. (FTDL)
Traeger, Inc. (BTH)
Traeger, Inc. (JAH)
|
|
Industry / Sector / Ticker Info
Analyst Coverage: No
Industry Group: CONSM PD-MISC DIS
Sector: Consumer Discretionary
CUSIP: 89269P103
SIC: 3630
|
|
Fiscal Year
Fiscal Year End: December
Last Reported Quarter: 09/01/25
Next Expected EPS Date: 03/05/26
|
|
Share - Related Items
Shares Outstanding: 137.18
Most Recent Split Date: (:1)
Beta: 1.38
Market Capitalization: $122.19 (millions)
|
|
|
|
|
| |
| • EPS Information |
• Dividend Information |
| Analyst Coverage: No |
Dividend Yield: 0.00% |
| Current Fiscal Quarter EPS Consensus Estimate: $0.01 |
Indicated Annual Dividend: $0.00 |
| Current Fiscal Year EPS Consensus Estimate: $-0.05 |
Payout Ratio: |
| Number of Estimates in the Fiscal Year Consensus: 4.00 |
Change In Payout Ratio: |
| Estmated Long-Term EPS Growth Rate: % |
Last Dividend Paid: NA - $0.00 |
| Next EPS Report Date: 03/05/26 |
|
|
|
| |