| Zacks Company Profile for Corpay, Inc. (CPAY : NYSE) |
|
|
| |
| • Company Description |
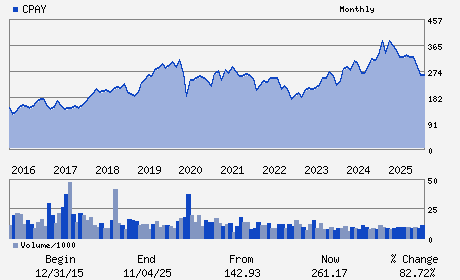
| Corpay Inc. is a corporate payments company which helps businesses and consumers pay expenses in a simple, controlled manner. The company offer payment solutions. Corpay Inc., formerly known as FLEETCOR Technologies Inc., is based in ATLANTA.
Number of Employees: 11,200 |
|
|
| |
| • Price / Volume Information |
| Yesterday's Closing Price: $337.12 |
Daily Weekly Monthly
 |
| 20 Day Moving Average: 695,408 shares |
| Shares Outstanding: 69.96 (millions) |
| Market Capitalization: $23,584.26 (millions) |
| Beta: 0.82 |
| 52 Week High: $386.88 |
| 52 Week Low: $252.84 |
| Short Interest Ratio: |
| |
% Price Change |
% Price Change Relative to S&P 500 |
| 4 Week |
5.13% |
6.73% |
| 12 Week |
16.72% |
12.74% |
| Year To Date |
12.03% |
12.18% |
|
|
|
|
| |
|
|
| |
| • General Corporate Information |
Officers
Ronald F. Clarke - Chief Executive Officer;Chairman of the Board of D
Tom Panther - Chief Financial Officer
Alissa B. Vickery - Chief Accounting Officer
Annabelle G. Bexiga - Director
Joseph W. Farrelly - Director
|
|
Peer Information
Corpay, Inc. (FISV)
Corpay, Inc. (USIO)
Corpay, Inc. (EEFT)
Corpay, Inc. (PAR)
Corpay, Inc. (RBA)
Corpay, Inc. (OPAY)
|
|
Industry / Sector / Ticker Info
Analyst Coverage: No
Industry Group: Financial Transaction Services
Sector: Business Services
CUSIP: 219948106
SIC: 7389
|
|
Fiscal Year
Fiscal Year End: December
Last Reported Quarter: 12/01/25
Next Expected EPS Date: 05/05/26
|
|
Share - Related Items
Shares Outstanding: 69.96
Most Recent Split Date: (:1)
Beta: 0.82
Market Capitalization: $23,584.26 (millions)
|
|
|
|
|
| |
| • EPS Information |
• Dividend Information |
| Analyst Coverage: No |
Dividend Yield: 0.00% |
| Current Fiscal Quarter EPS Consensus Estimate: $5.05 |
Indicated Annual Dividend: $0.00 |
| Current Fiscal Year EPS Consensus Estimate: $24.56 |
Payout Ratio: 0.00 |
| Number of Estimates in the Fiscal Year Consensus: 7.00 |
Change In Payout Ratio: 0.00 |
| Estmated Long-Term EPS Growth Rate: 14.11% |
Last Dividend Paid: NA - $0.00 |
| Next EPS Report Date: 05/05/26 |
|
|
|
| |