| Zacks Company Profile for DoorDash, Inc. (DASH : NSDQ) |
|
|
| |
| • Company Description |
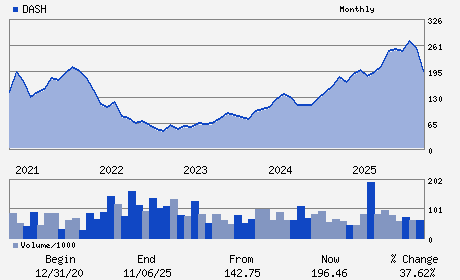
| DoorDash, Inc. provides restaurant food delivery services. The Company develops technology to connect customers with merchants through an on-demand food delivery application. DoorDash, Inc. is based in San Francisco, United States.
Number of Employees: 23,700 |
|
|
| |
| • Price / Volume Information |
| Yesterday's Closing Price: $161.14 |
Daily Weekly Monthly
 |
| 20 Day Moving Average: 4,664,880 shares |
| Shares Outstanding: 431.00 (millions) |
| Market Capitalization: $69,451.10 (millions) |
| Beta: 1.77 |
| 52 Week High: $285.50 |
| 52 Week Low: $155.43 |
| Short Interest Ratio: |
| |
% Price Change |
% Price Change Relative to S&P 500 |
| 4 Week |
-23.31% |
-22.05% |
| 12 Week |
-14.16% |
-17.86% |
| Year To Date |
-28.85% |
-28.72% |
|
|
|
|
| |
| • Address & Contact Information |
| Street Address |
Phone / Fax |
Email Address |
Web URL |
303 2ND STREET SOUTH TOWER 8TH FLOOR
-
SAN FRANCISCO,CA 94107
USA |
ph: 650-487-3970
fax: - |
ir@doordash.com |
http://www.doordash.com |
|
|
| |
| • General Corporate Information |
Officers
Tony Xu - Chief Executive Officer
Ravi Inukonda - Chief Financial Officer
Gordon Lee - Chief Accounting Officer
Jeffrey Blackburn - Director
Shona L. Brown - Director
|
|
Peer Information
DoorDash, Inc. (BIZZ)
DoorDash, Inc. (DCLK)
DoorDash, Inc. (DGIN.)
DoorDash, Inc. (DVW)
DoorDash, Inc. (CYCHZ)
DoorDash, Inc. (IFXC)
|
|
Industry / Sector / Ticker Info
Analyst Coverage: No
Industry Group: INTERNET SERVICES
Sector: Computer and Technology
CUSIP: 25809K105
SIC: 7389
|
|
Fiscal Year
Fiscal Year End: December
Last Reported Quarter: 09/01/25
Next Expected EPS Date: 02/18/26
|
|
Share - Related Items
Shares Outstanding: 431.00
Most Recent Split Date: (:1)
Beta: 1.77
Market Capitalization: $69,451.10 (millions)
|
|
|
|
|
| |
| • EPS Information |
• Dividend Information |
| Analyst Coverage: No |
Dividend Yield: 0.00% |
| Current Fiscal Quarter EPS Consensus Estimate: $0.64 |
Indicated Annual Dividend: $0.00 |
| Current Fiscal Year EPS Consensus Estimate: $3.14 |
Payout Ratio: 0.00 |
| Number of Estimates in the Fiscal Year Consensus: 14.00 |
Change In Payout Ratio: |
| Estmated Long-Term EPS Growth Rate: % |
Last Dividend Paid: NA - $0.00 |
| Next EPS Report Date: 02/18/26 |
|
|
|
| |