| Zacks Company Profile for Dream Finders Homes, Inc. (DFH : NYSE) |
|
|
| |
| • Company Description |
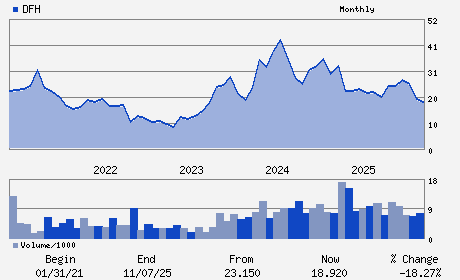
| Dream Finders Homes Inc. is a homebuilding company. It operates principally in Florida, Texas, North Carolina, South Carolina, Georgia, Colorado, Virginia and Maryland. Dream Finders Homes Inc. is based in Jacksonville, FL.
Number of Employees: 1,686 |
|
|
| |
| • Price / Volume Information |
| Yesterday's Closing Price: $21.05 |
Daily Weekly Monthly
 |
| 20 Day Moving Average: 407,117 shares |
| Shares Outstanding: 92.75 (millions) |
| Market Capitalization: $1,952.49 (millions) |
| Beta: 1.86 |
| 52 Week High: $31.50 |
| 52 Week Low: $16.59 |
| Short Interest Ratio: |
| |
% Price Change |
% Price Change Relative to S&P 500 |
| 4 Week |
3.69% |
5.34% |
| 12 Week |
18.99% |
13.82% |
| Year To Date |
23.10% |
19.46% |
|
|
|
|
| |
| • Address & Contact Information |
| Street Address |
Phone / Fax |
Email Address |
Web URL |
14701 PHILIPS HIGHWAY SUITE 300
-
JACKSONVILLE,FL 32256
USA |
ph: 904-644-7670
fax: - |
None |
http://www.dreamfindershomes.com |
|
|
| |
| • General Corporate Information |
Officers
Patrick O. Zalupski - Chief Executive Officer; Chairman of the Board of
L. Anabel Ramsay - Senior Vice President and Chief Financial Officer
W. Radford Lovett - Director
Justin W. Udelhofen - Director
Megha H. Parekh - Director
|
|
Peer Information
Dream Finders Homes, Inc. (CLPO)
Dream Finders Homes, Inc. (IAHM)
Dream Finders Homes, Inc. (HLCO)
Dream Finders Homes, Inc. (ENGEF)
Dream Finders Homes, Inc. (BZH)
Dream Finders Homes, Inc. (CSHHY)
|
|
Industry / Sector / Ticker Info
Analyst Coverage: No
Industry Group: BLDG-RSDNT/COMR
Sector: Construction
CUSIP: 26154D100
SIC: 1531
|
|
Fiscal Year
Fiscal Year End: December
Last Reported Quarter: 09/01/25
Next Expected EPS Date: 02/24/26
|
|
Share - Related Items
Shares Outstanding: 92.75
Most Recent Split Date: (:1)
Beta: 1.86
Market Capitalization: $1,952.49 (millions)
|
|
|
|
|
| |
| • EPS Information |
• Dividend Information |
| Analyst Coverage: No |
Dividend Yield: 0.00% |
| Current Fiscal Quarter EPS Consensus Estimate: $ |
Indicated Annual Dividend: $0.00 |
| Current Fiscal Year EPS Consensus Estimate: $2.03 |
Payout Ratio: 0.00 |
| Number of Estimates in the Fiscal Year Consensus: 1.00 |
Change In Payout Ratio: 0.00 |
| Estmated Long-Term EPS Growth Rate: 1.54% |
Last Dividend Paid: NA - $0.00 |
| Next EPS Report Date: 02/24/26 |
|
|
|
| |