| Zacks Company Profile for Dorchester Minerals, L.P. (DMLP : NSDQ) |
|
|
| |
| • Company Description |
| Dorchester Minerals, L.P. engages in the acquisition, ownership, and administration of producing and nonproducing natural gas and crude oil royalty, net profits, and leasehold interests in the United States. The Company owns two categories of properties: the Net Profits Interests and the Royalty Properties, the former representing net profits overriding royalty interests in various properties owned by the operating partnership and the latter comprising of producing and nonproducing mineral, royalty, overriding royalty, net profits, and leasehold interests. The company is based in Dallas, Texas.
Number of Employees: 27 |
|
|
| |
| • Price / Volume Information |
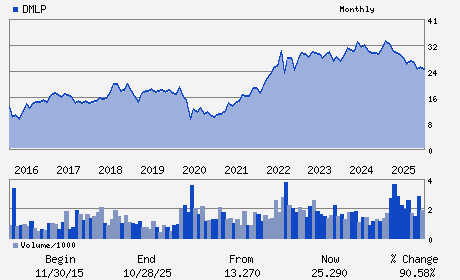
| Yesterday's Closing Price: $25.48 |
Daily Weekly Monthly
 |
| 20 Day Moving Average: 182,344 shares |
| Shares Outstanding: 48.26 (millions) |
| Market Capitalization: $1,229.54 (millions) |
| Beta: 0.65 |
| 52 Week High: $32.47 |
| 52 Week Low: $20.85 |
| Short Interest Ratio: |
| |
% Price Change |
% Price Change Relative to S&P 500 |
| 4 Week |
9.31% |
11.04% |
| 12 Week |
12.05% |
7.17% |
| Year To Date |
13.95% |
13.00% |
|
|
|
|
| |
| • Address & Contact Information |
| Street Address |
Phone / Fax |
Email Address |
Web URL |
3838 OAK LAWN AVENUE SUITE 300
-
DALLAS,TX 75219
USA |
ph: 214-559-0300
fax: 302-655-5049 |
None |
http://www.dmlp.net |
|
|
| |
| • General Corporate Information |
Officers
Bradley Ehrman - Chief Executive Officer
William Casey McManemin - Chairman and Manager
Lesley R. Carver - Manager
Martha Ann Peak Rochelle - Manager
Ronald P. Trout - Manager
|
|
Peer Information
Dorchester Minerals, L.P. (DOMR)
Dorchester Minerals, L.P. (FRHLF)
Dorchester Minerals, L.P. (CRT)
Dorchester Minerals, L.P. (MOSH)
Dorchester Minerals, L.P. (LRTR)
Dorchester Minerals, L.P. (TRRU)
|
|
Industry / Sector / Ticker Info
Analyst Coverage: No
Industry Group: OIL-US RYLTY TR
Sector: Oils/Energy
CUSIP: 25820R105
SIC: 1311
|
|
Fiscal Year
Fiscal Year End: December
Last Reported Quarter: 09/01/25
Next Expected EPS Date: 02/19/26
|
|
Share - Related Items
Shares Outstanding: 48.26
Most Recent Split Date: (:1)
Beta: 0.65
Market Capitalization: $1,229.54 (millions)
|
|
|
|
|
| |
| • EPS Information |
• Dividend Information |
| Analyst Coverage: No |
Dividend Yield: 11.86% |
| Current Fiscal Quarter EPS Consensus Estimate: $ |
Indicated Annual Dividend: $3.02 |
| Current Fiscal Year EPS Consensus Estimate: $ |
Payout Ratio: 2.30 |
| Number of Estimates in the Fiscal Year Consensus: |
Change In Payout Ratio: 0.93 |
| Estmated Long-Term EPS Growth Rate: % |
Last Dividend Paid: 02/02/2026 - $0.76 |
| Next EPS Report Date: 02/19/26 |
|
|
|
| |