| Zacks Company Profile for EyePoint, Inc. (EYPT : NSDQ) |
|
|
| |
| • Company Description |
| EYEPOINT INC is a clinical-stage biopharmaceutical company committed to developing and commercializing therapeutics to improve the lives of patients with serious retinal diseases. EYEPOINT INC, formerly known as EyePoint Pharmaceuticals Inc., is based in WATERTOWN, Mass.
Number of Employees: 165 |
|
|
| |
| • Price / Volume Information |
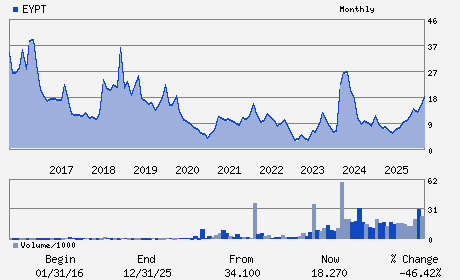
| Yesterday's Closing Price: $12.94 |
Daily Weekly Monthly
 |
| 20 Day Moving Average: 1,029,658 shares |
| Shares Outstanding: 82.79 (millions) |
| Market Capitalization: $1,071.27 (millions) |
| Beta: 1.76 |
| 52 Week High: $19.11 |
| 52 Week Low: $3.91 |
| Short Interest Ratio: |
| |
% Price Change |
% Price Change Relative to S&P 500 |
| 4 Week |
-14.19% |
-12.89% |
| 12 Week |
-5.41% |
-8.64% |
| Year To Date |
-29.17% |
-29.08% |
|
|
|
|
| |
|
|
| |
| • General Corporate Information |
Officers
Jay S. Duker - President; Chief Executive Officer and Director
Goran Ando - Chairman
Nancy Lurker - Vice Chairman
George O. Elston - Executive Vice President and Chief Financial Offic
Wendy DiCicco - Director
|
|
Peer Information
EyePoint, Inc. (CORR.)
EyePoint, Inc. (RSPI)
EyePoint, Inc. (CGXP)
EyePoint, Inc. (BGEN)
EyePoint, Inc. (GTBP)
EyePoint, Inc. (RGRX)
|
|
Industry / Sector / Ticker Info
Analyst Coverage: No
Industry Group: MED-BIOMED/GENE
Sector: Medical
CUSIP: 30233G209
SIC: 3826
|
|
Fiscal Year
Fiscal Year End: December
Last Reported Quarter: 09/01/25
Next Expected EPS Date: 03/04/26
|
|
Share - Related Items
Shares Outstanding: 82.79
Most Recent Split Date: 12.00 (0.10:1)
Beta: 1.76
Market Capitalization: $1,071.27 (millions)
|
|
|
|
|
| |
| • EPS Information |
• Dividend Information |
| Analyst Coverage: No |
Dividend Yield: 0.00% |
| Current Fiscal Quarter EPS Consensus Estimate: $-0.69 |
Indicated Annual Dividend: $0.00 |
| Current Fiscal Year EPS Consensus Estimate: $-2.82 |
Payout Ratio: |
| Number of Estimates in the Fiscal Year Consensus: 5.00 |
Change In Payout Ratio: |
| Estmated Long-Term EPS Growth Rate: % |
Last Dividend Paid: NA - $0.00 |
| Next EPS Report Date: 03/04/26 |
|
|
|
| |