| Zacks Company Profile for Robinhood Markets, Inc. (HOOD : NSDQ) |
|
|
| |
| • Company Description |
| Robinhood Financial LLC is a registered broker dealer. Robinhood Securities, LLC provides brokerage clearing services. Robinhood Crypto, LLC provides crypto currency trading. All are subsidiaries of Robinhood Markets, Inc.
Number of Employees: 2,300 |
|
|
| |
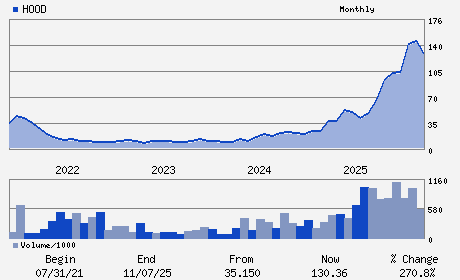
| • Price / Volume Information |
| Yesterday's Closing Price: $75.97 |
Daily Weekly Monthly
 |
| 20 Day Moving Average: 34,556,232 shares |
| Shares Outstanding: 899.19 (millions) |
| Market Capitalization: $68,311.39 (millions) |
| Beta: 2.43 |
| 52 Week High: $153.86 |
| 52 Week Low: $29.66 |
| Short Interest Ratio: |
| |
% Price Change |
% Price Change Relative to S&P 500 |
| 4 Week |
-31.16% |
-30.06% |
| 12 Week |
-28.47% |
-31.58% |
| Year To Date |
-32.83% |
-37.00% |
|
|
|
|
| |
|
|
| |
| • General Corporate Information |
Officers
Vladimir Tenev - Chief Executive Officer; President; and Director
Jason Warnick - Chief Financial Officer
Baiju Bhatt - Director
Paula Loop - Director
Jonathan Rubinstein - Director
|
|
Peer Information
Robinhood Markets, Inc. (HDHL)
Robinhood Markets, Inc. (AGE.)
Robinhood Markets, Inc. (DIR)
Robinhood Markets, Inc. (SIEB)
Robinhood Markets, Inc. (OPY)
Robinhood Markets, Inc. (FFGI)
|
|
Industry / Sector / Ticker Info
Analyst Coverage: No
Industry Group: FIN-INVEST BKRS
Sector: Finance
CUSIP: 770700102
SIC: 6211
|
|
Fiscal Year
Fiscal Year End: December
Last Reported Quarter: 12/01/25
Next Expected EPS Date: 04/29/26
|
|
Share - Related Items
Shares Outstanding: 899.19
Most Recent Split Date: (:1)
Beta: 2.43
Market Capitalization: $68,311.39 (millions)
|
|
|
|
|
| |
| • EPS Information |
• Dividend Information |
| Analyst Coverage: No |
Dividend Yield: 0.00% |
| Current Fiscal Quarter EPS Consensus Estimate: $0.58 |
Indicated Annual Dividend: $0.00 |
| Current Fiscal Year EPS Consensus Estimate: $2.43 |
Payout Ratio: 0.00 |
| Number of Estimates in the Fiscal Year Consensus: 9.00 |
Change In Payout Ratio: |
| Estmated Long-Term EPS Growth Rate: 25.89% |
Last Dividend Paid: NA - $0.00 |
| Next EPS Report Date: 04/29/26 |
|
|
|
| |