| Zacks Company Profile for Hormel Foods Corporation (HRL : NYSE) |
|
|
| |
| • Company Description |
| Hormel Foods Corporation is a leading manufacturer as well as marketer of various meat and food products in the U.S. and international markets. Its brands include Planters(TM), SKIPPY(TM), SPAM(TM), Hormel(TM), Natural Choice(TM), Applegate(TM), Justin's(TM), Wholly(TM), Hormel(TM), Black Label(TM), Columbus(TM), Jennie-O(TM) and more than 30 other brands.
Number of Employees: 20,000 |
|
|
| |
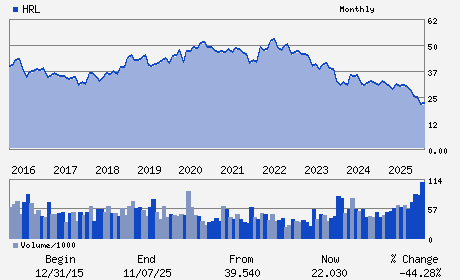
| • Price / Volume Information |
| Yesterday's Closing Price: $23.78 |
Daily Weekly Monthly
 |
| 20 Day Moving Average: 4,312,009 shares |
| Shares Outstanding: 550.11 (millions) |
| Market Capitalization: $13,081.55 (millions) |
| Beta: 0.33 |
| 52 Week High: $32.07 |
| 52 Week Low: $21.03 |
| Short Interest Ratio: |
| |
% Price Change |
% Price Change Relative to S&P 500 |
| 4 Week |
-1.82% |
-0.33% |
| 12 Week |
4.80% |
1.23% |
| Year To Date |
0.34% |
0.47% |
|
|
|
|
| |
|
|
| |
| • General Corporate Information |
Officers
Jeffrey M. Ettinger - Chief Executive Officer
John F. Ghingo - President
Paul R. Kuehneman - Chief Financial Officer and Controller
D. SCOTT AAKRE - Director
GARY C. BHOJWANI - Director
|
|
Peer Information
Hormel Foods Corporation (CAGAQ)
Hormel Foods Corporation (SFD)
Hormel Foods Corporation (DOBQ)
Hormel Foods Corporation (HAMS)
Hormel Foods Corporation (TAVI.)
Hormel Foods Corporation (SFD.)
|
|
Industry / Sector / Ticker Info
Analyst Coverage: No
Industry Group: FOOD-MEAT PRODS
Sector: Consumer Staples
CUSIP: 440452100
SIC: 2011
|
|
Fiscal Year
Fiscal Year End: October
Last Reported Quarter: 10/01/25
Next Expected EPS Date: 02/18/26
|
|
Share - Related Items
Shares Outstanding: 550.11
Most Recent Split Date: 2.00 (2.00:1)
Beta: 0.33
Market Capitalization: $13,081.55 (millions)
|
|
|
|
|
| |
| • EPS Information |
• Dividend Information |
| Analyst Coverage: No |
Dividend Yield: 4.92% |
| Current Fiscal Quarter EPS Consensus Estimate: $0.36 |
Indicated Annual Dividend: $1.17 |
| Current Fiscal Year EPS Consensus Estimate: $1.46 |
Payout Ratio: 0.85 |
| Number of Estimates in the Fiscal Year Consensus: 5.00 |
Change In Payout Ratio: 0.18 |
| Estmated Long-Term EPS Growth Rate: 6.75% |
Last Dividend Paid: 01/12/2026 - $0.29 |
| Next EPS Report Date: 02/18/26 |
|
|
|
| |