| Zacks Company Profile for iRhythm Holdings, Inc. (IRTC : NSDQ) |
|
|
| |
| • Company Description |
| IRHYTHM HLDGS is a digital health care company which creates trusted solutions that detect, predict and prevent disease. IRHYTHM HLDGS, formerly known as iRhythm Technologies Inc., is based in SAN FRANCISCO.
Number of Employees: 2,000 |
|
|
| |
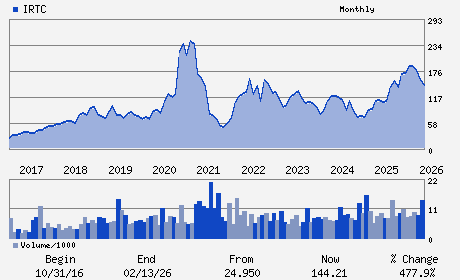
| • Price / Volume Information |
| Yesterday's Closing Price: $144.21 |
Daily Weekly Monthly
 |
| 20 Day Moving Average: 608,536 shares |
| Shares Outstanding: 32.22 (millions) |
| Market Capitalization: $4,646.32 (millions) |
| Beta: 1.06 |
| 52 Week High: $212.00 |
| 52 Week Low: $92.52 |
| Short Interest Ratio: |
| |
% Price Change |
% Price Change Relative to S&P 500 |
| 4 Week |
-13.73% |
-12.42% |
| 12 Week |
-18.90% |
-21.67% |
| Year To Date |
-18.73% |
-18.62% |
|
|
|
|
| |
|
|
| |
| • General Corporate Information |
Officers
Quentin S. Blackford - President and Chief Executive Officer
Abhijit Y. Talwalkar - Chairman
Daniel Wilson - Chief Financial Officer
Marc Rosenbaum - Chief Accounting Officer
Bruce G. Bodaken - Director
|
|
Peer Information
iRhythm Holdings, Inc. (HLIS)
iRhythm Holdings, Inc. (AZTA)
iRhythm Holdings, Inc. (APYI)
iRhythm Holdings, Inc. (RNVA)
iRhythm Holdings, Inc. (HMSY)
iRhythm Holdings, Inc. (LRSI)
|
|
Industry / Sector / Ticker Info
Analyst Coverage: No
Industry Group: MEDICAL INFO SYS
Sector: Medical
CUSIP: 450056106
SIC: 3841
|
|
Fiscal Year
Fiscal Year End: December
Last Reported Quarter: 09/01/25
Next Expected EPS Date: 02/19/26
|
|
Share - Related Items
Shares Outstanding: 32.22
Most Recent Split Date: (:1)
Beta: 1.06
Market Capitalization: $4,646.32 (millions)
|
|
|
|
|
| |
| • EPS Information |
• Dividend Information |
| Analyst Coverage: No |
Dividend Yield: 0.00% |
| Current Fiscal Quarter EPS Consensus Estimate: $-0.46 |
Indicated Annual Dividend: $0.00 |
| Current Fiscal Year EPS Consensus Estimate: $-0.43 |
Payout Ratio: |
| Number of Estimates in the Fiscal Year Consensus: 6.00 |
Change In Payout Ratio: |
| Estmated Long-Term EPS Growth Rate: 35.16% |
Last Dividend Paid: NA - $0.00 |
| Next EPS Report Date: 02/19/26 |
|
|
|
| |