| Zacks Company Profile for Kestra Medical Technologies, Ltd. (KMTS : NSDQ) |
|
|
| |
| • Company Description |
| Kestra Medical Technologies, Ltd. is a commercial-stage wearable medical device and digital healthcare company focused on transforming patient outcomes in cardiovascular disease using monitoring and therapeutic intervention technologies. Kestra Medical Technologies, Ltd. is based in KIRKLAND, Wash.
Number of Employees: 330 |
|
|
| |
| • Price / Volume Information |
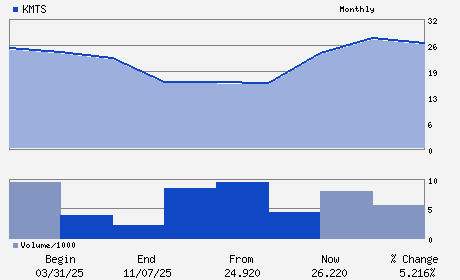
| Yesterday's Closing Price: $26.92 |
Daily Weekly Monthly
 |
| 20 Day Moving Average: 215,084 shares |
| Shares Outstanding: 58.35 (millions) |
| Market Capitalization: $1,570.76 (millions) |
| Beta: |
| 52 Week High: $30.00 |
| 52 Week Low: $13.25 |
| Short Interest Ratio: |
| |
% Price Change |
% Price Change Relative to S&P 500 |
| 4 Week |
17.15% |
19.00% |
| 12 Week |
7.72% |
3.04% |
| Year To Date |
1.51% |
3.74% |
|
|
|
|
| |
|
|
| |
| • General Corporate Information |
Officers
Brian Webster - President and Chief Executive Officer
Jeff Schwartz - Chairman
Vaseem Mahboob - Chief Financial Officer
Traci Umberger - General Counsel; Chief Administrative Officer and
Christopher Gordon - Director
|
|
Peer Information
Kestra Medical Technologies, Ltd. (BJCT)
Kestra Medical Technologies, Ltd. (CADMQ)
Kestra Medical Technologies, Ltd. (APNO)
Kestra Medical Technologies, Ltd. (UPDC)
Kestra Medical Technologies, Ltd. (IMTIQ)
Kestra Medical Technologies, Ltd. (CYGN)
|
|
Industry / Sector / Ticker Info
Analyst Coverage: No
Industry Group: MED PRODUCTS
Sector: Medical
CUSIP: G52441105
SIC: 3841
|
|
Fiscal Year
Fiscal Year End: April
Last Reported Quarter: 10/01/25
Next Expected EPS Date: -
|
|
Share - Related Items
Shares Outstanding: 58.35
Most Recent Split Date: (:1)
Beta:
Market Capitalization: $1,570.76 (millions)
|
|
|
|
|
| |
| • EPS Information |
• Dividend Information |
| Analyst Coverage: No |
Dividend Yield: 0.00% |
| Current Fiscal Quarter EPS Consensus Estimate: $-0.57 |
Indicated Annual Dividend: $0.00 |
| Current Fiscal Year EPS Consensus Estimate: $-2.32 |
Payout Ratio: |
| Number of Estimates in the Fiscal Year Consensus: 2.00 |
Change In Payout Ratio: |
| Estmated Long-Term EPS Growth Rate: 30.21% |
Last Dividend Paid: NA - $0.00 |
| Next EPS Report Date: - |
|
|
|
| |