| Zacks Company Profile for Live Nation Entertainment, Inc. (LYV : NYSE) |
|
|
| |
| • Company Description |
| Live Nation Entertainment, Inc. operates as a live entertainment company. The company owns, operates, and has exclusive booking rights for or has an equity interest in venues, which includes House of Blues music venues and prestigious locations such as The Fillmore in San Francisco, Brooklyn Bowl, the Hollywood Palladium, etc. The company operates via three segments: Concerts segment promotes live music events in its owned or operated venues and rented third-party venues; produces music festivals; makes related content; and provides management as well as other services to artists. Ticketing segment manages the ticketing operations. This segment sells tickets for its events, as well as for third-party clients in numerous live event categories. The segment's operating costs include all center costs and credit card fees, along with other costs. Sponsorship & Advertisingsegment sells international, national, and local sponsorships and placement of advertising.
Number of Employees: 32,200 |
|
|
| |
| • Price / Volume Information |
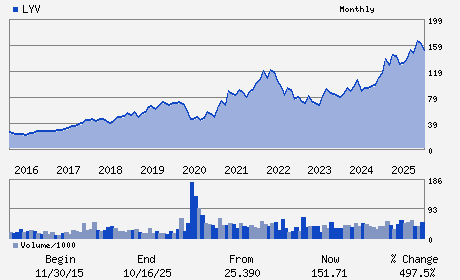
| Yesterday's Closing Price: $158.27 |
Daily Weekly Monthly
 |
| 20 Day Moving Average: 2,535,598 shares |
| Shares Outstanding: 234.74 (millions) |
| Market Capitalization: $37,152.50 (millions) |
| Beta: 1.18 |
| 52 Week High: $175.25 |
| 52 Week Low: $112.88 |
| Short Interest Ratio: |
| |
% Price Change |
% Price Change Relative to S&P 500 |
| 4 Week |
9.58% |
11.25% |
| 12 Week |
21.16% |
17.03% |
| Year To Date |
11.07% |
11.22% |
|
|
|
|
| |
|
|
| |
| • General Corporate Information |
Officers
Michael Rapino - President; Chief Executive Officer and Director
Joe Berchtold - Chief Financial Officer
Brian Capo - Chief Accounting Officer
Maverick Carter - Director
Ping Fu - Director
|
|
Peer Information
Live Nation Entertainment, Inc. (BDLN)
Live Nation Entertainment, Inc. (M.IMX)
Live Nation Entertainment, Inc. (AFTC.)
Live Nation Entertainment, Inc. (CELC.)
Live Nation Entertainment, Inc. (CCTVY)
Live Nation Entertainment, Inc. (NLMP)
|
|
Industry / Sector / Ticker Info
Analyst Coverage: No
Industry Group: MOVIE/TV PRD&DIST
Sector: Consumer Discretionary
CUSIP: 538034109
SIC: 7900
|
|
Fiscal Year
Fiscal Year End: December
Last Reported Quarter: 09/01/25
Next Expected EPS Date: 02/19/26
|
|
Share - Related Items
Shares Outstanding: 234.74
Most Recent Split Date: (:1)
Beta: 1.18
Market Capitalization: $37,152.50 (millions)
|
|
|
|
|
| |
| • EPS Information |
• Dividend Information |
| Analyst Coverage: No |
Dividend Yield: 0.00% |
| Current Fiscal Quarter EPS Consensus Estimate: $-0.23 |
Indicated Annual Dividend: $0.00 |
| Current Fiscal Year EPS Consensus Estimate: $2.08 |
Payout Ratio: 0.00 |
| Number of Estimates in the Fiscal Year Consensus: 8.00 |
Change In Payout Ratio: 0.00 |
| Estmated Long-Term EPS Growth Rate: 7.25% |
Last Dividend Paid: NA - $0.00 |
| Next EPS Report Date: 02/19/26 |
|
|
|
| |