| Zacks Company Profile for Mama's Creations, Inc. (MAMA : NSDQ) |
|
|
| |
| • Company Description |
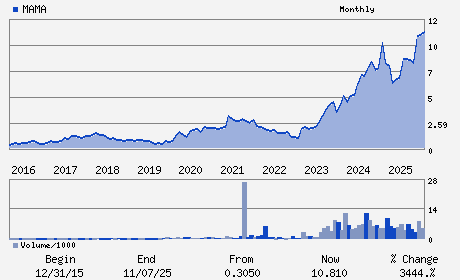
| Mama's Creations Inc. is a marketer and manufacturer of fresh deli prepared foods which serves grocery, mass, club and convenience stores. Mama's Creations Inc., formerly known as MamaMancini's Holdings Inc., is based in EAST RUTHERFORD, NJ.
Number of Employees: 305 |
|
|
| |
| • Price / Volume Information |
| Yesterday's Closing Price: $15.53 |
Daily Weekly Monthly
 |
| 20 Day Moving Average: 470,222 shares |
| Shares Outstanding: 40.65 (millions) |
| Market Capitalization: $631.34 (millions) |
| Beta: 0.80 |
| 52 Week High: $16.68 |
| 52 Week Low: $5.50 |
| Short Interest Ratio: |
| |
% Price Change |
% Price Change Relative to S&P 500 |
| 4 Week |
13.11% |
14.90% |
| 12 Week |
52.70% |
46.06% |
| Year To Date |
15.12% |
11.99% |
|
|
|
|
| |
|
|
| |
| • General Corporate Information |
Officers
Adam L. Michaels - Chief Executive Officer and Chairman
Moore (Skip) Tappan - Chief Operating Officer
Anthony J. Gruber - Chief Financial Officer
Steven Burns - Director
Tom Toto - Director
|
|
Peer Information
Mama's Creations, Inc. (CDSCY)
Mama's Creations, Inc. (HDNHY)
Mama's Creations, Inc. (CPB)
Mama's Creations, Inc. (AMNF)
Mama's Creations, Inc. (GMFIY)
Mama's Creations, Inc. (BRID)
|
|
Industry / Sector / Ticker Info
Analyst Coverage: No
Industry Group: FOOD-MISC/DIVERSIFIED
Sector: Consumer Staples
CUSIP: 56146T103
SIC: 2013
|
|
Fiscal Year
Fiscal Year End: January
Last Reported Quarter: 10/01/25
Next Expected EPS Date: 04/14/26
|
|
Share - Related Items
Shares Outstanding: 40.65
Most Recent Split Date: (:1)
Beta: 0.80
Market Capitalization: $631.34 (millions)
|
|
|
|
|
| |
| • EPS Information |
• Dividend Information |
| Analyst Coverage: No |
Dividend Yield: 0.00% |
| Current Fiscal Quarter EPS Consensus Estimate: $0.04 |
Indicated Annual Dividend: $0.00 |
| Current Fiscal Year EPS Consensus Estimate: $0.24 |
Payout Ratio: 0.00 |
| Number of Estimates in the Fiscal Year Consensus: 1.00 |
Change In Payout Ratio: 0.00 |
| Estmated Long-Term EPS Growth Rate: % |
Last Dividend Paid: NA - $0.00 |
| Next EPS Report Date: 04/14/26 |
|
|
|
| |