| Zacks Company Profile for Maison Luxe, Inc. (MASN : OTC) |
|
|
| |
| • Company Description |
| Maison Luxe Inc. provides custom luxury goods marketplace. The Company also owns its Amani Jewelers subsidiary, which operates in the jewelry marketplace. Maison Luxe Inc., formerly known as Clikia Corp., is based in FORT LEE, NJ.
Number of Employees: 1 |
|
|
| |
| • Price / Volume Information |
| Yesterday's Closing Price: $0.00 |
Daily Weekly Monthly
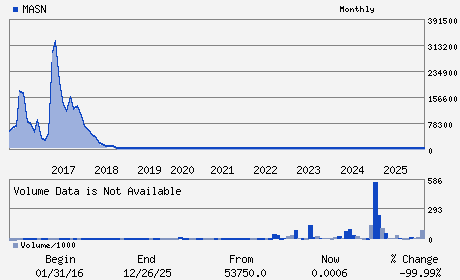 |
| 20 Day Moving Average: 1,369,326 shares |
| Shares Outstanding: 480.09 (millions) |
| Market Capitalization: $0.29 (millions) |
| Beta: 1.11 |
| 52 Week High: $0.00 |
| 52 Week Low: $0.00 |
| Short Interest Ratio: |
| |
% Price Change |
% Price Change Relative to S&P 500 |
| 4 Week |
0.00% |
1.58% |
| 12 Week |
50.00% |
43.47% |
| Year To Date |
% |
% |
|
|
|
|
| |
|
|
| |
| • General Corporate Information |
Officers
Anil Idnani - Chief Executive Officer
John Cormier - Director
- - -
- - -
- - -
|
|
Peer Information
Maison Luxe, Inc. (COCQ)
Maison Luxe, Inc. (JAS)
Maison Luxe, Inc. (JAS.B)
Maison Luxe, Inc. (HKFIQ)
Maison Luxe, Inc. (CNJ)
Maison Luxe, Inc. (T.CTC)
|
|
Industry / Sector / Ticker Info
Analyst Coverage: No
Industry Group: RETAIL-MISC/DIV
Sector: Retail/Wholesale
CUSIP: 56066P107
SIC: 5944
|
|
Fiscal Year
Fiscal Year End: March
Last Reported Quarter: 12/01/25
Next Expected EPS Date: 08/11/26
|
|
Share - Related Items
Shares Outstanding: 480.09
Most Recent Split Date: 4.00 (0.01:1)
Beta: 1.11
Market Capitalization: $0.29 (millions)
|
|
|
|
|
| |
| • EPS Information |
• Dividend Information |
| Analyst Coverage: No |
Dividend Yield: 0.00% |
| Current Fiscal Quarter EPS Consensus Estimate: $ |
Indicated Annual Dividend: $0.00 |
| Current Fiscal Year EPS Consensus Estimate: $ |
Payout Ratio: |
| Number of Estimates in the Fiscal Year Consensus: |
Change In Payout Ratio: |
| Estmated Long-Term EPS Growth Rate: % |
Last Dividend Paid: NA - $0.00 |
| Next EPS Report Date: 08/11/26 |
|
|
|
| |