| Zacks Company Profile for MBIA, Inc. (MBI : NYSE) |
|
|
| |
| • Company Description |
| MBIA Incorporated is engaged in providing financial guaranteeinsurance and investment management and financial services to public finance clients and financial institutions on a global basis. Financial guarantees for municipal bonds, asset-backed and mortgage-backed securities, investor-owned utility bonds, and collateralized obligations of sovereigns, corporations and financial institutions, both in the new issue and secondary markets, are provided through the Company's wholly-owned subsidiary, MBIA Insurance Corporation.
Number of Employees: 57 |
|
|
| |
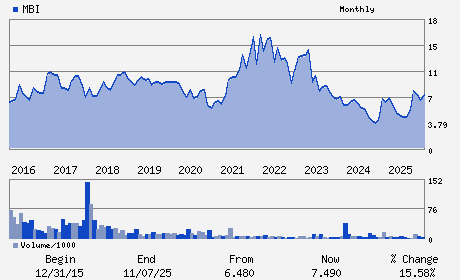
| • Price / Volume Information |
| Yesterday's Closing Price: $6.04 |
Daily Weekly Monthly
 |
| 20 Day Moving Average: 340,192 shares |
| Shares Outstanding: 50.49 (millions) |
| Market Capitalization: $304.98 (millions) |
| Beta: 1.89 |
| 52 Week High: $8.26 |
| 52 Week Low: $3.86 |
| Short Interest Ratio: |
| |
% Price Change |
% Price Change Relative to S&P 500 |
| 4 Week |
-12.46% |
-11.13% |
| 12 Week |
-20.74% |
-23.44% |
| Year To Date |
-15.64% |
-15.53% |
|
|
|
|
| |
| • Address & Contact Information |
| Street Address |
Phone / Fax |
Email Address |
Web URL |
1 MANHATTANVILLE ROAD SUITE 301
-
PURCHASE,NY 10577
USA |
ph: 914-273-4545
fax: 914-765-3177 |
greg.diamond@mbia.com |
http://www.mbia.com |
|
|
| |
| • General Corporate Information |
Officers
William C. Fallon - Chief Executive Officer and Director
Steven J. Gilbert - Chairman
Joseph R. Schachinger - Chief Financial Officer
Shengying Yu - Assistant Vice President and Controller
Theodore Shasta - Director
|
|
Peer Information
MBIA, Inc. (RDN)
MBIA, Inc. (AIG)
MBIA, Inc. (ACGI)
MBIA, Inc. (TXSC)
MBIA, Inc. (PTVCB)
MBIA, Inc. (PTVCA)
|
|
Industry / Sector / Ticker Info
Analyst Coverage: No
Industry Group: INS-MULTI LINE
Sector: Finance
CUSIP: 55262C100
SIC: 6351
|
|
Fiscal Year
Fiscal Year End: December
Last Reported Quarter: 09/01/25
Next Expected EPS Date: 02/26/26
|
|
Share - Related Items
Shares Outstanding: 50.49
Most Recent Split Date: 4.00 (1.50:1)
Beta: 1.89
Market Capitalization: $304.98 (millions)
|
|
|
|
|
| |
| • EPS Information |
• Dividend Information |
| Analyst Coverage: No |
Dividend Yield: 0.00% |
| Current Fiscal Quarter EPS Consensus Estimate: $-0.11 |
Indicated Annual Dividend: $0.00 |
| Current Fiscal Year EPS Consensus Estimate: $-0.27 |
Payout Ratio: |
| Number of Estimates in the Fiscal Year Consensus: 1.00 |
Change In Payout Ratio: |
| Estmated Long-Term EPS Growth Rate: % |
Last Dividend Paid: NA - $0.00 |
| Next EPS Report Date: 02/26/26 |
|
|
|
| |