| Zacks Company Profile for MFA Financial, Inc. (MFA : NYSE) |
|
|
| |
| • Company Description |
| MFA Mortgage Investments, Inc. operates as a real estate investment trust primarily engaged in the business of investing in mortgage-backed securities. The company also has indirect investment in Lealand Place, a multifamily apartment property located in Lawrenceville, Georgia. In addition, it provides investment advisory services to a third-party institution with respect to their MBS portfolio investments.
Number of Employees: 348 |
|
|
| |
| • Price / Volume Information |
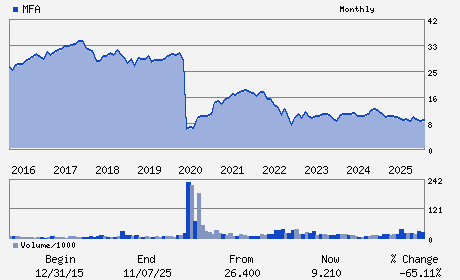
| Yesterday's Closing Price: $9.89 |
Daily Weekly Monthly
 |
| 20 Day Moving Average: 1,369,696 shares |
| Shares Outstanding: 102.20 (millions) |
| Market Capitalization: $1,010.72 (millions) |
| Beta: 1.59 |
| 52 Week High: $11.08 |
| 52 Week Low: $7.85 |
| Short Interest Ratio: |
| |
% Price Change |
% Price Change Relative to S&P 500 |
| 4 Week |
-2.08% |
-0.59% |
| 12 Week |
7.97% |
4.29% |
| Year To Date |
6.23% |
6.37% |
|
|
|
|
| |
|
|
| |
| • General Corporate Information |
Officers
Craig L. Knutson - Chief Executive Officer and Director
Laurie Goodman - Chair and Director
Michael Roper - Chief Financial Officer
Bryan Doran - Chief Accounting Officer
Robin Josephs - Director
|
|
Peer Information
MFA Financial, Inc. (CHAS.)
MFA Financial, Inc. (DVLN)
MFA Financial, Inc. (ACPIQ)
MFA Financial, Inc. (MITT)
MFA Financial, Inc. (AAIC)
MFA Financial, Inc. (WAC)
|
|
Industry / Sector / Ticker Info
Analyst Coverage: No
Industry Group: REIT-MTGE TRUST
Sector: Finance
CUSIP: 55272X607
SIC: 6798
|
|
Fiscal Year
Fiscal Year End: December
Last Reported Quarter: 09/01/25
Next Expected EPS Date: 02/18/26
|
|
Share - Related Items
Shares Outstanding: 102.20
Most Recent Split Date: 4.00 (0.25:1)
Beta: 1.59
Market Capitalization: $1,010.72 (millions)
|
|
|
|
|
| |
| • EPS Information |
• Dividend Information |
| Analyst Coverage: No |
Dividend Yield: 14.56% |
| Current Fiscal Quarter EPS Consensus Estimate: $ |
Indicated Annual Dividend: $1.44 |
| Current Fiscal Year EPS Consensus Estimate: $ |
Payout Ratio: 1.44 |
| Number of Estimates in the Fiscal Year Consensus: |
Change In Payout Ratio: 0.21 |
| Estmated Long-Term EPS Growth Rate: % |
Last Dividend Paid: 12/31/2025 - $0.36 |
| Next EPS Report Date: 02/18/26 |
|
|
|
| |