| Zacks Company Profile for Marcus & Millichap, Inc. (MMI : NYSE) |
|
|
| |
| • Company Description |
| Marcus & Millichap, Inc. operates a brokerage firm specializing in real estate investments. It offers commercial real estate investment brokerage services for multifamily, retail, office, industrial, land, self-storage, seniors housing, manufactured housing, and mixed-use/other property types. The company also provides a range of advisory and consulting services to developers, lenders, owners, real estate investment trusts, high net worth individuals, pension fund advisors, and other institutions. Marcus & Millichap, Inc. is based in Calabasas, California.
Number of Employees: 897 |
|
|
| |
| • Price / Volume Information |
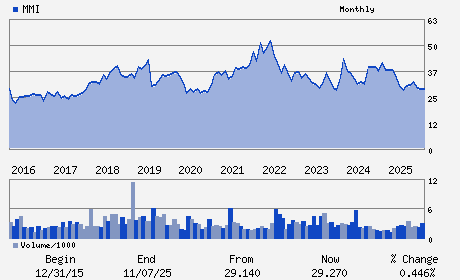
| Yesterday's Closing Price: $25.85 |
Daily Weekly Monthly
 |
| 20 Day Moving Average: 260,777 shares |
| Shares Outstanding: 38.92 (millions) |
| Market Capitalization: $1,006.15 (millions) |
| Beta: 1.32 |
| 52 Week High: $41.94 |
| 52 Week Low: $24.43 |
| Short Interest Ratio: |
| |
% Price Change |
% Price Change Relative to S&P 500 |
| 4 Week |
-5.21% |
-3.77% |
| 12 Week |
-12.40% |
-15.39% |
| Year To Date |
-5.28% |
-5.15% |
|
|
|
|
| |
|
|
| |
| • General Corporate Information |
Officers
Hessam Nadji - President and Chief Executive Officer
Steven F. DeGennaro - Chief Financial Officer
Kurt H. Schwarz - First Vice President of Finance and Chief Account
George M. Marcus - Director
Collete English Dixon - Director
|
|
Peer Information
Marcus & Millichap, Inc. (AVHI.)
Marcus & Millichap, Inc. (HNGKY)
Marcus & Millichap, Inc. (INTG)
Marcus & Millichap, Inc. (FCAR)
Marcus & Millichap, Inc. (AIHC)
Marcus & Millichap, Inc. (CDGD)
|
|
Industry / Sector / Ticker Info
Analyst Coverage: No
Industry Group: REAL ESTATE DEV
Sector: Finance
CUSIP: 566324109
SIC: 6531
|
|
Fiscal Year
Fiscal Year End: December
Last Reported Quarter: 12/01/25
Next Expected EPS Date: 05/06/26
|
|
Share - Related Items
Shares Outstanding: 38.92
Most Recent Split Date: (:1)
Beta: 1.32
Market Capitalization: $1,006.15 (millions)
|
|
|
|
|
| |
| • EPS Information |
• Dividend Information |
| Analyst Coverage: No |
Dividend Yield: 1.93% |
| Current Fiscal Quarter EPS Consensus Estimate: $ |
Indicated Annual Dividend: $0.50 |
| Current Fiscal Year EPS Consensus Estimate: $ |
Payout Ratio: 12.50 |
| Number of Estimates in the Fiscal Year Consensus: |
Change In Payout Ratio: 11.15 |
| Estmated Long-Term EPS Growth Rate: % |
Last Dividend Paid: NA - $0.00 |
| Next EPS Report Date: 05/06/26 |
|
|
|
| |