| Zacks Company Profile for MSC Industrial Direct Company, Inc. (MSM : NYSE) |
|
|
| |
| • Company Description |
| MSC Industrial Direct Co., Inc. is one of the premier distributors of Metalworking and Maintenance, Repair and Operations (`MRO`) supplies to industrial customers throughout the United States. MSC distributes approximately 590,000 industrial products from approximately 3,000 suppliers to approximately 350,000 customers. MSC reaches its customers through a combination of approximately 27 million direct-mail catalogs and CD-ROMs, 96 branch sales offices, 927 sales people, the Internet and associations with some of the world's most prominent B2B e-commerce portals.
Number of Employees: 7,284 |
|
|
| |
| • Price / Volume Information |
| Yesterday's Closing Price: $94.04 |
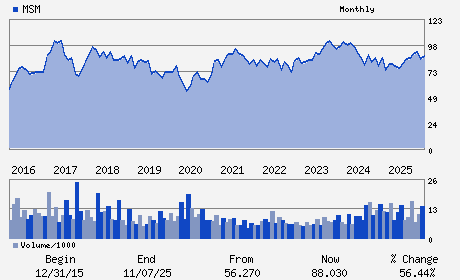
Daily Weekly Monthly
 |
| 20 Day Moving Average: 680,343 shares |
| Shares Outstanding: 55.80 (millions) |
| Market Capitalization: $5,247.74 (millions) |
| Beta: 0.84 |
| 52 Week High: $96.99 |
| 52 Week Low: $68.10 |
| Short Interest Ratio: |
| |
% Price Change |
% Price Change Relative to S&P 500 |
| 4 Week |
10.95% |
12.63% |
| 12 Week |
6.74% |
3.10% |
| Year To Date |
11.82% |
11.97% |
|
|
|
|
| |
|
|
| |
| • General Corporate Information |
Officers
Erik Gershwind - Chief Executive Officer
Mitchell Jacobson - Non-Executive Chairman of the Board of Directors
Greg Clark - Vice President and Interim Chief Financial Officer
Robert Aarnes - Director
Louise Goeser - Director
|
|
Peer Information
MSC Industrial Direct Company, Inc. (BOOM)
MSC Industrial Direct Company, Inc. (AMBIQ)
MSC Industrial Direct Company, Inc. (DSGR)
MSC Industrial Direct Company, Inc. (MSM)
MSC Industrial Direct Company, Inc. (SIEGY)
MSC Industrial Direct Company, Inc. (MATTQ)
|
|
Industry / Sector / Ticker Info
Analyst Coverage: No
Industry Group: Industrial Services
Sector: Industrial Products
CUSIP: 553530106
SIC: 5084
|
|
Fiscal Year
Fiscal Year End: August
Last Reported Quarter: 11/01/25
Next Expected EPS Date: 04/02/26
|
|
Share - Related Items
Shares Outstanding: 55.80
Most Recent Split Date: 5.00 (2.00:1)
Beta: 0.84
Market Capitalization: $5,247.74 (millions)
|
|
|
|
|
| |
| • EPS Information |
• Dividend Information |
| Analyst Coverage: No |
Dividend Yield: 3.70% |
| Current Fiscal Quarter EPS Consensus Estimate: $0.84 |
Indicated Annual Dividend: $3.48 |
| Current Fiscal Year EPS Consensus Estimate: $4.28 |
Payout Ratio: 0.90 |
| Number of Estimates in the Fiscal Year Consensus: 11.00 |
Change In Payout Ratio: 0.25 |
| Estmated Long-Term EPS Growth Rate: % |
Last Dividend Paid: 01/14/2026 - $0.87 |
| Next EPS Report Date: 04/02/26 |
|
|
|
| |