| Zacks Company Profile for National Bankshares, Inc. (NKSH : NSDQ) |
|
|
| |
| • Company Description |
| National Bankshares, Inc. is a bank holding company. Except for a separate investment portfolio, Bankshares conducts all of its business operations through its two wholly-owned subsidiaries, The National Bank of Blacksburg and Bank of Tazewell County .
Number of Employees: 245 |
|
|
| |
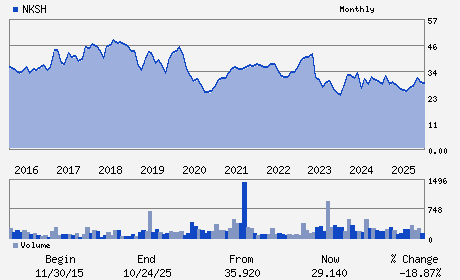
| • Price / Volume Information |
| Yesterday's Closing Price: $38.14 |
Daily Weekly Monthly
 |
| 20 Day Moving Average: 15,975 shares |
| Shares Outstanding: 6.37 (millions) |
| Market Capitalization: $242.80 (millions) |
| Beta: 0.72 |
| 52 Week High: $40.00 |
| 52 Week Low: $23.75 |
| Short Interest Ratio: |
| |
% Price Change |
% Price Change Relative to S&P 500 |
| 4 Week |
11.13% |
12.82% |
| 12 Week |
25.67% |
21.38% |
| Year To Date |
13.75% |
13.90% |
|
|
|
|
| |
|
|
| |
| • General Corporate Information |
Officers
F. Brad Denardo - Chairman and CEO
Lara E. Ramsey - President; Corporate Secretary
Lora M. Jones - Treasurer and CFO
Norman V. Fitzwater, III - Director
Charles. E. Green, III - Director
|
|
Peer Information
National Bankshares, Inc. (TSFG)
National Bankshares, Inc. (ABCB)
National Bankshares, Inc. (CFNL)
National Bankshares, Inc. (CPKF)
National Bankshares, Inc. (HIB)
National Bankshares, Inc. (FVB)
|
|
Industry / Sector / Ticker Info
Analyst Coverage: No
Industry Group: BANKS-SOUTHEAST
Sector: Finance
CUSIP: 634865109
SIC: 6021
|
|
Fiscal Year
Fiscal Year End: December
Last Reported Quarter: 12/01/25
Next Expected EPS Date: 04/23/26
|
|
Share - Related Items
Shares Outstanding: 6.37
Most Recent Split Date: 4.00 (2.00:1)
Beta: 0.72
Market Capitalization: $242.80 (millions)
|
|
|
|
|
| |
| • EPS Information |
• Dividend Information |
| Analyst Coverage: No |
Dividend Yield: 4.09% |
| Current Fiscal Quarter EPS Consensus Estimate: $0.65 |
Indicated Annual Dividend: $1.56 |
| Current Fiscal Year EPS Consensus Estimate: $2.82 |
Payout Ratio: 0.60 |
| Number of Estimates in the Fiscal Year Consensus: 1.00 |
Change In Payout Ratio: -0.22 |
| Estmated Long-Term EPS Growth Rate: % |
Last Dividend Paid: 11/24/2025 - $0.78 |
| Next EPS Report Date: 04/23/26 |
|
|
|
| |