| Zacks Company Profile for Nelnet, Inc. (NNI : NYSE) |
|
|
| |
| • Company Description |
| Nelnet Inc is an educational finance companies and is focused on providing quality student loan products and services to students and schools nationwide. Nelnet offers a broad range of student loan and financial services and technology-based products, including student loan origination and lending, guarantee servicing, and a suite of software solutions. Their products are designed to simplify the student loan process by automating financial aid delivery, loan processing, and funds disbursement.
Number of Employees: 6,739 |
|
|
| |
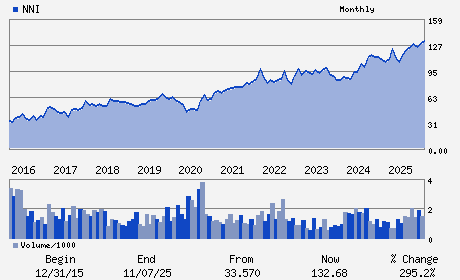
| • Price / Volume Information |
| Yesterday's Closing Price: $129.63 |
Daily Weekly Monthly
 |
| 20 Day Moving Average: 81,052 shares |
| Shares Outstanding: 35.93 (millions) |
| Market Capitalization: $4,658.01 (millions) |
| Beta: 0.82 |
| 52 Week High: $142.87 |
| 52 Week Low: $98.15 |
| Short Interest Ratio: |
| |
% Price Change |
% Price Change Relative to S&P 500 |
| 4 Week |
-2.20% |
-0.72% |
| 12 Week |
1.46% |
-2.00% |
| Year To Date |
-2.50% |
-2.37% |
|
|
|
|
| |
|
|
| |
| • General Corporate Information |
Officers
Jeffrey R. Noordhoek - Chief Executive Officer
Michael S. Dunlap - Executive Chairman
James D. Kruger - Chief Financial Officer
Preeta D. Bansal - Director
Matthew W. Dunlap - Director
|
|
Peer Information
Nelnet, Inc. (EZPW)
Nelnet, Inc. (FPLPY)
Nelnet, Inc. (FMACQ)
Nelnet, Inc. (ASFI)
Nelnet, Inc. (ACAR.)
Nelnet, Inc. (HI.)
|
|
Industry / Sector / Ticker Info
Analyst Coverage: No
Industry Group: FIN-CONS LOANS
Sector: Finance
CUSIP: 64031N108
SIC: 6141
|
|
Fiscal Year
Fiscal Year End: December
Last Reported Quarter: 09/01/25
Next Expected EPS Date: 02/26/26
|
|
Share - Related Items
Shares Outstanding: 35.93
Most Recent Split Date: (:1)
Beta: 0.82
Market Capitalization: $4,658.01 (millions)
|
|
|
|
|
| |
| • EPS Information |
• Dividend Information |
| Analyst Coverage: No |
Dividend Yield: 1.02% |
| Current Fiscal Quarter EPS Consensus Estimate: $ |
Indicated Annual Dividend: $1.32 |
| Current Fiscal Year EPS Consensus Estimate: $8.81 |
Payout Ratio: 0.10 |
| Number of Estimates in the Fiscal Year Consensus: 1.00 |
Change In Payout Ratio: -0.08 |
| Estmated Long-Term EPS Growth Rate: % |
Last Dividend Paid: 12/01/2025 - $0.33 |
| Next EPS Report Date: 02/26/26 |
|
|
|
| |