| Zacks Company Profile for Olaplex Holdings, Inc. (OLPX : NSDQ) |
|
|
| |
| • Company Description |
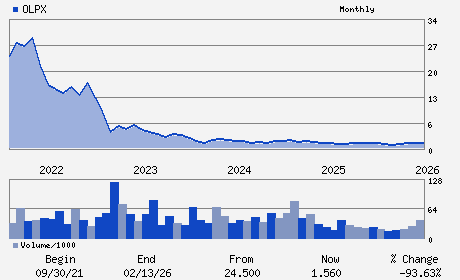
| Olaplex Holdings Inc. is a technology-driven beauty company. The brand's products have an active, patent-protected ingredient which works on a molecular level to protect and repair hair from damage. The company's products are sold through omni-channel platform serving the professional, specialty retail and direct-to-consumer channels. Olaplex Holdings Inc. is based in SANTA BARBARA, Calif.
Number of Employees: 231 |
|
|
| |
| • Price / Volume Information |
| Yesterday's Closing Price: $1.56 |
Daily Weekly Monthly
 |
| 20 Day Moving Average: 994,571 shares |
| Shares Outstanding: 667.51 (millions) |
| Market Capitalization: $1,041.32 (millions) |
| Beta: 2.26 |
| 52 Week High: $1.84 |
| 52 Week Low: $0.99 |
| Short Interest Ratio: |
| |
% Price Change |
% Price Change Relative to S&P 500 |
| 4 Week |
-5.45% |
-3.96% |
| 12 Week |
51.46% |
44.87% |
| Year To Date |
16.42% |
13.64% |
|
|
|
|
| |
|
|
| |
| • General Corporate Information |
Officers
Amanda Baldwin - Chief Executive Officer
John P. Bilbrey - Chairman
Catherine Dunleavy - Chief Operating Officer and Chief Financial Office
Kenneth F. Egan - Chief Accounting Officer
Tricia Glynn - Director
|
|
Peer Information
Olaplex Holdings, Inc. (LENXQ)
Olaplex Holdings, Inc. (BFXXQ)
Olaplex Holdings, Inc. (CENT)
Olaplex Holdings, Inc. (FTDL)
Olaplex Holdings, Inc. (BTH)
Olaplex Holdings, Inc. (JAH)
|
|
Industry / Sector / Ticker Info
Analyst Coverage: No
Industry Group: CONSM PD-MISC DIS
Sector: Consumer Discretionary
CUSIP: 679369108
SIC: 2844
|
|
Fiscal Year
Fiscal Year End: December
Last Reported Quarter: 09/01/25
Next Expected EPS Date: 03/03/26
|
|
Share - Related Items
Shares Outstanding: 667.51
Most Recent Split Date: (:1)
Beta: 2.26
Market Capitalization: $1,041.32 (millions)
|
|
|
|
|
| |
| • EPS Information |
• Dividend Information |
| Analyst Coverage: No |
Dividend Yield: 0.00% |
| Current Fiscal Quarter EPS Consensus Estimate: $0.02 |
Indicated Annual Dividend: $0.00 |
| Current Fiscal Year EPS Consensus Estimate: $0.08 |
Payout Ratio: 0.00 |
| Number of Estimates in the Fiscal Year Consensus: 6.00 |
Change In Payout Ratio: 0.00 |
| Estmated Long-Term EPS Growth Rate: % |
Last Dividend Paid: NA - $0.00 |
| Next EPS Report Date: 03/03/26 |
|
|
|
| |