| Zacks Company Profile for Omnicom Group Inc. (OMC : NYSE) |
|
|
| |
| • Company Description |
| Omnicom is one of the largest advertising, marketing and corporate communications companies in the world. The company's agencies operate in all the major markets across the globe and provide an extensive range of services. Areas of operation include North America, Latin America, Europe, the Middle East, Australia, China, India, Japan, Korea, Africa, New Zealand, Singapore, and other Asian countries. The company operates in a fiercely competitive industry and competes with global, national and regional advertising and marketing services companies. It also competes with technology, social media and professional services companies.
Number of Employees: 74,900 |
|
|
| |
| • Price / Volume Information |
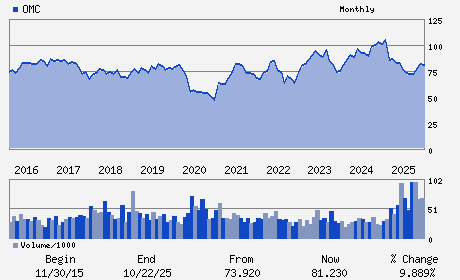
| Yesterday's Closing Price: $69.00 |
Daily Weekly Monthly
 |
| 20 Day Moving Average: 4,332,254 shares |
| Shares Outstanding: 192.98 (millions) |
| Market Capitalization: $13,315.87 (millions) |
| Beta: 0.74 |
| 52 Week High: $89.27 |
| 52 Week Low: $66.33 |
| Short Interest Ratio: |
| |
% Price Change |
% Price Change Relative to S&P 500 |
| 4 Week |
-13.52% |
-12.21% |
| 12 Week |
-7.84% |
-10.98% |
| Year To Date |
-14.55% |
-14.43% |
|
|
|
|
| |
|
|
| |
| • General Corporate Information |
Officers
John D. Wren - Chief Executive Officer; Chairman and Director
Philip J. Angelastro - Chief Financial Officer and Executive Vice Preside
Andrew L. Castellaneta - Chief Accounting Officer; Senior Vice President
Mary C. Choksi - Director
Leonard S. Coleman, Jr. - Director
|
|
Peer Information
Omnicom Group Inc. (IBDI)
Omnicom Group Inc. (VAPR)
Omnicom Group Inc. (SWWI)
Omnicom Group Inc. (GREY)
Omnicom Group Inc. (JCDXF)
Omnicom Group Inc. (GMIG)
|
|
Industry / Sector / Ticker Info
Analyst Coverage: No
Industry Group: ADVERTISING/MKTG SVCS
Sector: Business Services
CUSIP: 681919106
SIC: 7311
|
|
Fiscal Year
Fiscal Year End: December
Last Reported Quarter: 09/01/25
Next Expected EPS Date: 02/18/26
|
|
Share - Related Items
Shares Outstanding: 192.98
Most Recent Split Date: 6.00 (2.00:1)
Beta: 0.74
Market Capitalization: $13,315.87 (millions)
|
|
|
|
|
| |
| • EPS Information |
• Dividend Information |
| Analyst Coverage: No |
Dividend Yield: 4.64% |
| Current Fiscal Quarter EPS Consensus Estimate: $1.87 |
Indicated Annual Dividend: $3.20 |
| Current Fiscal Year EPS Consensus Estimate: $9.38 |
Payout Ratio: 0.33 |
| Number of Estimates in the Fiscal Year Consensus: 3.00 |
Change In Payout Ratio: -0.07 |
| Estmated Long-Term EPS Growth Rate: 6.79% |
Last Dividend Paid: 12/19/2025 - $0.80 |
| Next EPS Report Date: 02/18/26 |
|
|
|
| |