| Zacks Company Profile for Oppenheimer Holdings, Inc. (OPY : NYSE) |
|
|
| |
| • Company Description |
| Oppenheimer Holdings Inc. operates as a middle-market investment bank through its subsidiaries. It provides financial and wealth planning services, margin lending, securities lending, discount brokerage services and asset management services. It also provides strategic advisory services and capital markets product, institutional equity sales and trading, equity research, equity options, derivatives, convertible bonds, event driven sales and trading services. Oppenheimer Holdings Inc. is headquartered in New York, New York.
Number of Employees: 3,018 |
|
|
| |
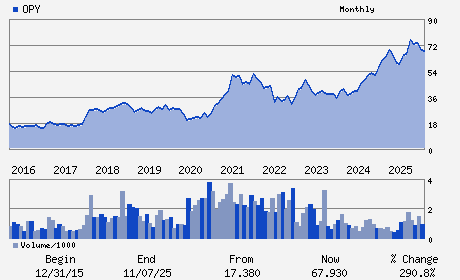
| • Price / Volume Information |
| Yesterday's Closing Price: $85.85 |
Daily Weekly Monthly
 |
| 20 Day Moving Average: 55,477 shares |
| Shares Outstanding: 10.52 (millions) |
| Market Capitalization: $903.19 (millions) |
| Beta: 1.20 |
| 52 Week High: $94.10 |
| 52 Week Low: $49.26 |
| Short Interest Ratio: |
| |
% Price Change |
% Price Change Relative to S&P 500 |
| 4 Week |
4.61% |
6.19% |
| 12 Week |
29.92% |
25.49% |
| Year To Date |
18.76% |
18.92% |
|
|
|
|
| |
| • Address & Contact Information |
| Street Address |
Phone / Fax |
Email Address |
Web URL |
85 BROAD STREET 22ND FLOOR
-
NEW YORK,NY 10004
USA |
ph: 212-668-8000
fax: 212-943-8728 |
info@opco.com |
http://www.oppenheimer.com |
|
|
| |
| • General Corporate Information |
Officers
A.G. Lowenthal - Chief Executive Officer and Chairman
R.S. Lowenthal - President
B.M. Watkins - Chief Financial Officer
E. Behrens - Director
T. Dwyer - Director
|
|
Peer Information
Oppenheimer Holdings, Inc. (HDHL)
Oppenheimer Holdings, Inc. (AGE.)
Oppenheimer Holdings, Inc. (DIR)
Oppenheimer Holdings, Inc. (SIEB)
Oppenheimer Holdings, Inc. (OPY)
Oppenheimer Holdings, Inc. (FFGI)
|
|
Industry / Sector / Ticker Info
Analyst Coverage: No
Industry Group: FIN-INVEST BKRS
Sector: Finance
CUSIP: 683797104
SIC: 6211
|
|
Fiscal Year
Fiscal Year End: December
Last Reported Quarter: 12/01/25
Next Expected EPS Date: 04/24/26
|
|
Share - Related Items
Shares Outstanding: 10.52
Most Recent Split Date: (:1)
Beta: 1.20
Market Capitalization: $903.19 (millions)
|
|
|
|
|
| |
| • EPS Information |
• Dividend Information |
| Analyst Coverage: No |
Dividend Yield: 0.84% |
| Current Fiscal Quarter EPS Consensus Estimate: $ |
Indicated Annual Dividend: $0.72 |
| Current Fiscal Year EPS Consensus Estimate: $ |
Payout Ratio: 0.06 |
| Number of Estimates in the Fiscal Year Consensus: |
Change In Payout Ratio: -0.06 |
| Estmated Long-Term EPS Growth Rate: % |
Last Dividend Paid: 02/13/2026 - $1.18 |
| Next EPS Report Date: 04/24/26 |
|
|
|
| |