| Zacks Company Profile for TDH Holdings, Inc. (PETZ : NSDQ) |
|
|
| |
| • Company Description |
| TDH Holdings, Inc. is a developer, manufacturer and distributer of pet food products primarily in the China, Asia and Europe. The Company's product consists of pet chews, dried pet snacks, dental health snacks and baked pet biscuits as well as non-food items like dog leashes, pet toys. TDH Holdings, Inc. is based in Qingdao, China.
Number of Employees: 17 |
|
|
| |
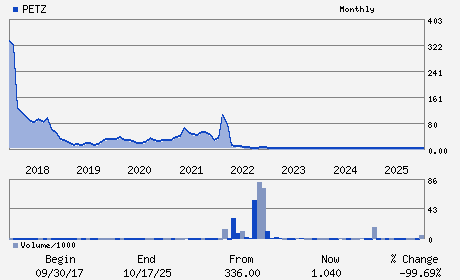
| • Price / Volume Information |
| Yesterday's Closing Price: $1.06 |
Daily Weekly Monthly
 |
| 20 Day Moving Average: 16,297 shares |
| Shares Outstanding: 10.32 (millions) |
| Market Capitalization: $10.94 (millions) |
| Beta: 1.56 |
| 52 Week High: $1.41 |
| 52 Week Low: $0.65 |
| Short Interest Ratio: |
| |
% Price Change |
% Price Change Relative to S&P 500 |
| 4 Week |
-0.93% |
0.57% |
| 12 Week |
9.67% |
5.93% |
| Year To Date |
16.48% |
16.64% |
|
|
|
|
| |
| • Address & Contact Information |
| Street Address |
Phone / Fax |
Email Address |
Web URL |
ROOM 1104 FULL TOWER 9 EAST THIRD RING MIDDLE ROAD CHAOYANG DISTRICT
-
BEIJING,F4 100020
CHN |
ph: 86-166-7863-6230
fax: 86-532-8591-9284 |
ir@tdhpet.com |
http://www.tdhpet.com |
|
|
| |
| • General Corporate Information |
Officers
Dandan Liu - Chief Executive Officer; Class A Director
Feng Zhang - Chief Financial Officer; Class A Director
Caifen Zou - Class B Director; independent
Qiu Li - Class B Director; independent
Owens Meng - Class C Director; independent
|
|
Peer Information
TDH Holdings, Inc. (CDSCY)
TDH Holdings, Inc. (HDNHY)
TDH Holdings, Inc. (CPB)
TDH Holdings, Inc. (AMNF)
TDH Holdings, Inc. (GMFIY)
TDH Holdings, Inc. (BRID)
|
|
Industry / Sector / Ticker Info
Analyst Coverage: No
Industry Group: FOOD-MISC/DIVERSIFIED
Sector: Consumer Staples
CUSIP: G87084110
SIC: 2000
|
|
Fiscal Year
Fiscal Year End: December
Last Reported Quarter: -
Next Expected EPS Date: 04/27/26
|
|
Share - Related Items
Shares Outstanding: 10.32
Most Recent Split Date: 6.00 (0.05:1)
Beta: 1.56
Market Capitalization: $10.94 (millions)
|
|
|
|
|
| |
| • EPS Information |
• Dividend Information |
| Analyst Coverage: No |
Dividend Yield: 0.00% |
| Current Fiscal Quarter EPS Consensus Estimate: $ |
Indicated Annual Dividend: $0.00 |
| Current Fiscal Year EPS Consensus Estimate: $ |
Payout Ratio: |
| Number of Estimates in the Fiscal Year Consensus: |
Change In Payout Ratio: |
| Estmated Long-Term EPS Growth Rate: % |
Last Dividend Paid: NA - $0.00 |
| Next EPS Report Date: 04/27/26 |
|
|
|
| |