| Zacks Company Profile for PLBY Group, Inc. (PLBY : NSDQ) |
|
|
| |
| • Company Description |
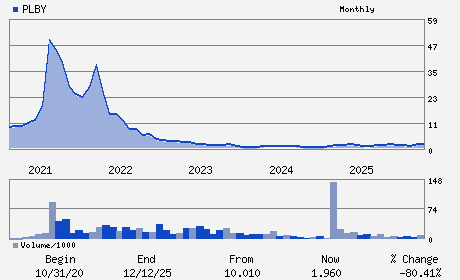
| PLBY Group Inc. is a pleasure and leisure lifestyle company. It serves consumers in categories which include Sexual Wellness, Style & Apparel, Gaming & Lifestyle and Beauty & Grooming. PLBY Group Inc., formerly known as Mountain Crest Acquisition Corp, is based in LOS ANGELES.
Number of Employees: 615 |
|
|
| |
| • Price / Volume Information |
| Yesterday's Closing Price: $1.99 |
Daily Weekly Monthly
 |
| 20 Day Moving Average: 1,788,335 shares |
| Shares Outstanding: 107.76 (millions) |
| Market Capitalization: $214.44 (millions) |
| Beta: 2.66 |
| 52 Week High: $2.75 |
| 52 Week Low: $0.90 |
| Short Interest Ratio: |
| |
% Price Change |
% Price Change Relative to S&P 500 |
| 4 Week |
1.02% |
2.62% |
| 12 Week |
20.61% |
15.36% |
| Year To Date |
5.85% |
23.10% |
|
|
|
|
| |
|
|
| |
| • General Corporate Information |
Officers
Ben Kohn - Chief Executive Officer; President and Director
Marc Crossman - Chief Financial Officer and Chief Operating Office
Suhail Rizvi - Director
Tracey Edmonds - Director
James Yaffe - Director
|
|
Peer Information
PLBY Group, Inc. (BAJAY)
PLBY Group, Inc. (ESCA)
PLBY Group, Inc. (GOYL)
PLBY Group, Inc. (FTSP)
PLBY Group, Inc. (KTO)
PLBY Group, Inc. (BOLL)
|
|
Industry / Sector / Ticker Info
Analyst Coverage: No
Industry Group: LEISURE&REC PRD
Sector: Consumer Discretionary
CUSIP: 72814P109
SIC: 5900
|
|
Fiscal Year
Fiscal Year End: December
Last Reported Quarter: 09/01/25
Next Expected EPS Date: 03/12/26
|
|
Share - Related Items
Shares Outstanding: 107.76
Most Recent Split Date: (:1)
Beta: 2.66
Market Capitalization: $214.44 (millions)
|
|
|
|
|
| |
| • EPS Information |
• Dividend Information |
| Analyst Coverage: No |
Dividend Yield: 0.00% |
| Current Fiscal Quarter EPS Consensus Estimate: $0.02 |
Indicated Annual Dividend: $0.00 |
| Current Fiscal Year EPS Consensus Estimate: $0.11 |
Payout Ratio: |
| Number of Estimates in the Fiscal Year Consensus: 1.00 |
Change In Payout Ratio: |
| Estmated Long-Term EPS Growth Rate: % |
Last Dividend Paid: NA - $0.00 |
| Next EPS Report Date: 03/12/26 |
|
|
|
| |