| Zacks Company Profile for The Pennant Group, Inc. (PNTG : NSDQ) |
|
|
| |
| • Company Description |
| The Pennant Group Inc. through subsidiaries offers home health, hospice and senior living services. It operates primarily in Arizona, California, Colorado, Idaho, Iowa, Nevada, Oklahoma, Oregon, Texas, Utah, Washington, Wisconsin and Wyoming. The Pennant Group Inc. is based in Eagle, United States.
Number of Employees: 7,000 |
|
|
| |
| • Price / Volume Information |
| Yesterday's Closing Price: $31.97 |
Daily Weekly Monthly
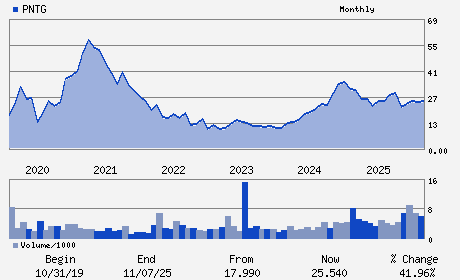 |
| 20 Day Moving Average: 328,920 shares |
| Shares Outstanding: 34.59 (millions) |
| Market Capitalization: $1,105.97 (millions) |
| Beta: 1.27 |
| 52 Week High: $32.44 |
| 52 Week Low: $21.52 |
| Short Interest Ratio: |
| |
% Price Change |
% Price Change Relative to S&P 500 |
| 4 Week |
6.92% |
8.62% |
| 12 Week |
23.39% |
18.02% |
| Year To Date |
13.57% |
10.90% |
|
|
|
|
| |
|
|
| |
| • General Corporate Information |
Officers
Brent J. Guerisoli - Chief Executive Officer
Barry M. Smith - Chairman
Lynette B. Walbom - Chief Financial Officer
Christopher R. Christensen - Director
John G. Nackel - Director
|
|
Peer Information
The Pennant Group, Inc. (CMTI)
The Pennant Group, Inc. (CMWLQ)
The Pennant Group, Inc. (AHG.)
The Pennant Group, Inc. (ROIX)
The Pennant Group, Inc. (M.DCE)
The Pennant Group, Inc. (DHSM)
|
|
Industry / Sector / Ticker Info
Analyst Coverage: No
Industry Group: MED-OUTP/HM CRE
Sector: Medical
CUSIP: 70805E109
SIC: 8000
|
|
Fiscal Year
Fiscal Year End: December
Last Reported Quarter: 09/01/25
Next Expected EPS Date: 02/25/26
|
|
Share - Related Items
Shares Outstanding: 34.59
Most Recent Split Date: (:1)
Beta: 1.27
Market Capitalization: $1,105.97 (millions)
|
|
|
|
|
| |
| • EPS Information |
• Dividend Information |
| Analyst Coverage: No |
Dividend Yield: 0.00% |
| Current Fiscal Quarter EPS Consensus Estimate: $0.25 |
Indicated Annual Dividend: $0.00 |
| Current Fiscal Year EPS Consensus Estimate: $1.11 |
Payout Ratio: 0.00 |
| Number of Estimates in the Fiscal Year Consensus: 3.00 |
Change In Payout Ratio: 0.00 |
| Estmated Long-Term EPS Growth Rate: 13.00% |
Last Dividend Paid: NA - $0.00 |
| Next EPS Report Date: 02/25/26 |
|
|
|
| |