| Zacks Company Profile for Perma-Pipe International Holdings, Inc. (PPIH : NSDQ) |
|
|
| |
| • Company Description |
| Perma-Pipe International Holdings, Inc. is a manufacturer of pre-insulated piping systems for District Heating and Cooling in North America. The Company offers process, secondary contained, leak detection, steam and condensate piping systems. Perma-Pipe International Holdings Inc., formerly known as MFRI INC., is based in Niles, United States.
Number of Employees: 175 |
|
|
| |
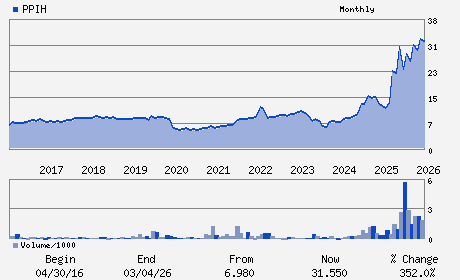
| • Price / Volume Information |
| Yesterday's Closing Price: $32.23 |
Daily Weekly Monthly
 |
| 20 Day Moving Average: 87,023 shares |
| Shares Outstanding: 8.09 (millions) |
| Market Capitalization: $260.87 (millions) |
| Beta: 0.52 |
| 52 Week High: $36.48 |
| 52 Week Low: $8.81 |
| Short Interest Ratio: |
| |
% Price Change |
% Price Change Relative to S&P 500 |
| 4 Week |
-0.83% |
0.68% |
| 12 Week |
34.12% |
29.55% |
| Year To Date |
6.16% |
6.30% |
|
|
|
|
| |
|
|
| |
| • General Corporate Information |
Officers
David J. Mansfield - Chief Executive Officer
Jerome T. Walker - Chairman
Saleh Sagr - President
Matthew E. Lewicki - Vice President and Chief Financial Officer
Robert Mcnally - Director
|
|
Peer Information
Perma-Pipe International Holdings, Inc. (NSS)
Perma-Pipe International Holdings, Inc. (AIU)
Perma-Pipe International Holdings, Inc. (DBMG)
Perma-Pipe International Holdings, Inc. (PPIH)
Perma-Pipe International Holdings, Inc. (TAM.)
Perma-Pipe International Holdings, Inc. (VMI)
|
|
Industry / Sector / Ticker Info
Analyst Coverage: No
Industry Group: STEEL-PIPE&TUBE
Sector: Industrial Products
CUSIP: 714167103
SIC: 3564
|
|
Fiscal Year
Fiscal Year End: January
Last Reported Quarter: 10/01/25
Next Expected EPS Date: 05/07/26
|
|
Share - Related Items
Shares Outstanding: 8.09
Most Recent Split Date: (:1)
Beta: 0.52
Market Capitalization: $260.87 (millions)
|
|
|
|
|
| |
| • EPS Information |
• Dividend Information |
| Analyst Coverage: No |
Dividend Yield: 0.00% |
| Current Fiscal Quarter EPS Consensus Estimate: $ |
Indicated Annual Dividend: $0.00 |
| Current Fiscal Year EPS Consensus Estimate: $ |
Payout Ratio: 0.00 |
| Number of Estimates in the Fiscal Year Consensus: |
Change In Payout Ratio: 0.00 |
| Estmated Long-Term EPS Growth Rate: % |
Last Dividend Paid: NA - $0.00 |
| Next EPS Report Date: 05/07/26 |
|
|
|
| |