| Zacks Company Profile for CarParts.com, Inc. (PRTS : NSDQ) |
|
|
| |
| • Company Description |
| CarParts.com Inc. offer e-commerce automotive aftermarket, providing collision, engine and performance parts and accessories. CarParts.com Inc., formerly known as U.S. Auto Parts Network Inc., is headquartered in Torrance, California.
Number of Employees: 1,466 |
|
|
| |
| • Price / Volume Information |
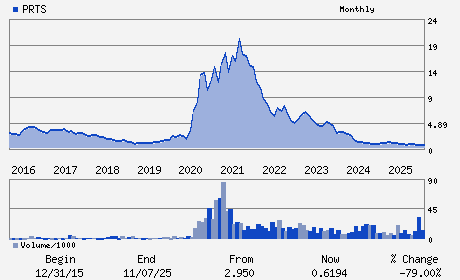
| Yesterday's Closing Price: $0.70 |
Daily Weekly Monthly
 |
| 20 Day Moving Average: 737,177 shares |
| Shares Outstanding: 69.76 (millions) |
| Market Capitalization: $48.83 (millions) |
| Beta: 0.94 |
| 52 Week High: $1.36 |
| 52 Week Low: $0.37 |
| Short Interest Ratio: |
| |
% Price Change |
% Price Change Relative to S&P 500 |
| 4 Week |
32.58% |
34.68% |
| 12 Week |
59.38% |
52.45% |
| Year To Date |
40.00% |
29.26% |
|
|
|
|
| |
| • Address & Contact Information |
| Street Address |
Phone / Fax |
Email Address |
Web URL |
2050 W. 190TH STREET SUITE 400
-
TORRANCE,CA 90504
USA |
ph: 424-702-1455
fax: 310-632-1681 |
ir@carparts.com |
http://www.carparts.com |
|
|
| |
| • General Corporate Information |
Officers
David Meniane - Chief Executive Officer and Director
Warren B. Phelps III - Chairman
Ryan Lockwood - Chief Financial Officer
Jay K. Greyson - Director
Jim Barnes - Director
|
|
Peer Information
CarParts.com, Inc. (M.BUD)
CarParts.com, Inc. (DCNAQ)
CarParts.com, Inc. (CGUL)
CarParts.com, Inc. (DAN)
CarParts.com, Inc. (CTTAY)
CarParts.com, Inc. (M.DEC)
|
|
Industry / Sector / Ticker Info
Analyst Coverage: No
Industry Group: AUTO/TRUCK-ORIG
Sector: Auto/Tires/Trucks
CUSIP: 14427M107
SIC: 5531
|
|
Fiscal Year
Fiscal Year End: December
Last Reported Quarter: 09/01/25
Next Expected EPS Date: 03/05/26
|
|
Share - Related Items
Shares Outstanding: 69.76
Most Recent Split Date: (:1)
Beta: 0.94
Market Capitalization: $48.83 (millions)
|
|
|
|
|
| |
| • EPS Information |
• Dividend Information |
| Analyst Coverage: No |
Dividend Yield: 0.00% |
| Current Fiscal Quarter EPS Consensus Estimate: $ |
Indicated Annual Dividend: $0.00 |
| Current Fiscal Year EPS Consensus Estimate: $ |
Payout Ratio: |
| Number of Estimates in the Fiscal Year Consensus: |
Change In Payout Ratio: |
| Estmated Long-Term EPS Growth Rate: % |
Last Dividend Paid: NA - $0.00 |
| Next EPS Report Date: 03/05/26 |
|
|
|
| |