| Zacks Company Profile for Peloton Interactive, Inc. (PTON : NSDQ) |
|
|
| |
| • Company Description |
| Peloton Interactive creates fitness products. The brand's content is accessible through the Peloton Bike, the Peloton Tread, and Peloton Digital, which provides a full slate of fitness offerings, anytime, anywhere, through IOS and Android as well as most tablets and computers.
Number of Employees: 2,145 |
|
|
| |
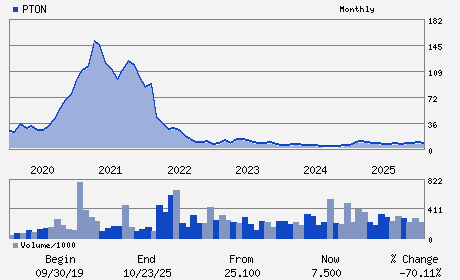
| • Price / Volume Information |
| Yesterday's Closing Price: $4.25 |
Daily Weekly Monthly
 |
| 20 Day Moving Average: 16,772,771 shares |
| Shares Outstanding: 417.81 (millions) |
| Market Capitalization: $1,775.68 (millions) |
| Beta: 2.41 |
| 52 Week High: $10.25 |
| 52 Week Low: $4.09 |
| Short Interest Ratio: |
| |
% Price Change |
% Price Change Relative to S&P 500 |
| 4 Week |
-36.57% |
-35.56% |
| 12 Week |
-33.49% |
-36.38% |
| Year To Date |
-31.01% |
-31.20% |
|
|
|
|
| |
|
|
| |
| • General Corporate Information |
Officers
Peter Stern - Chief Executive Officer; President and Director
Elizabeth F Coddington - Chief Financial Officer
Jay Hoag - Director
Karen Boone - Director
Chris Bruzzo - Director
|
|
Peer Information
Peloton Interactive, Inc. (BAJAY)
Peloton Interactive, Inc. (ESCA)
Peloton Interactive, Inc. (GOYL)
Peloton Interactive, Inc. (FTSP)
Peloton Interactive, Inc. (KTO)
Peloton Interactive, Inc. (BOLL)
|
|
Industry / Sector / Ticker Info
Analyst Coverage: No
Industry Group: LEISURE&REC PRD
Sector: Consumer Discretionary
CUSIP: 70614W100
SIC: 3949
|
|
Fiscal Year
Fiscal Year End: June
Last Reported Quarter: 12/01/25
Next Expected EPS Date: 05/14/26
|
|
Share - Related Items
Shares Outstanding: 417.81
Most Recent Split Date: (:1)
Beta: 2.41
Market Capitalization: $1,775.68 (millions)
|
|
|
|
|
| |
| • EPS Information |
• Dividend Information |
| Analyst Coverage: No |
Dividend Yield: 0.00% |
| Current Fiscal Quarter EPS Consensus Estimate: $0.04 |
Indicated Annual Dividend: $0.00 |
| Current Fiscal Year EPS Consensus Estimate: $0.11 |
Payout Ratio: |
| Number of Estimates in the Fiscal Year Consensus: 6.00 |
Change In Payout Ratio: |
| Estmated Long-Term EPS Growth Rate: 45.29% |
Last Dividend Paid: NA - $0.00 |
| Next EPS Report Date: 05/14/26 |
|
|
|
| |