| Zacks Company Profile for BRC Group Holdings, Inc. (RILY : NSDQ) |
|
|
| |
| • Company Description |
| BRC Group Holdings Inc. is a diversified portfolio of companies, including financial services, telecom and retail and investments in equity, debt and venture capital. Its financial services platform provides small cap and middle market companies customized end-to-end solutions. BRC Group Holdings Inc., formerly known as B. Riley Financial Inc., is based in LOS ANGELES.
Number of Employees: 2,056 |
|
|
| |
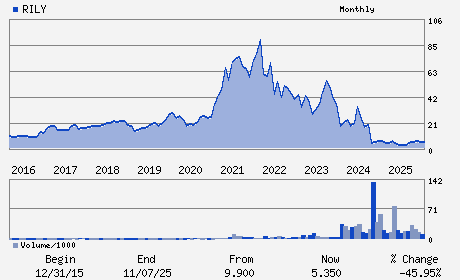
| • Price / Volume Information |
| Yesterday's Closing Price: $6.82 |
Daily Weekly Monthly
 |
| 20 Day Moving Average: 920,975 shares |
| Shares Outstanding: 31.22 (millions) |
| Market Capitalization: $212.91 (millions) |
| Beta: 1.27 |
| 52 Week High: $10.97 |
| 52 Week Low: $2.67 |
| Short Interest Ratio: |
| |
% Price Change |
% Price Change Relative to S&P 500 |
| 4 Week |
-23.28% |
-22.12% |
| 12 Week |
57.87% |
52.49% |
| Year To Date |
46.04% |
46.24% |
|
|
|
|
| |
| • Address & Contact Information |
| Street Address |
Phone / Fax |
Email Address |
Web URL |
11100 SANTA MONICA BLVD SUITE 800
-
LOS ANGELES,CA 90025
USA |
ph: 310-966-1444
fax: 310-966-1448 |
ir@brcgh.com |
http://www.brcgh.com |
|
|
| |
| • General Corporate Information |
Officers
Bryant R. Riley - Co-Chief Executive Officer and Chairman
Thomas J. Kelleher - Co-Chief Executive Officer
Scott Yessner - Executive Vice President and Chief Financial Offic
Alan N. Forman - Executive Vice President; General Counsel and Secr
Howard Weitzman - Senior Vice President and Chief Accounting Officer
|
|
Peer Information
BRC Group Holdings, Inc. (EIIN)
BRC Group Holdings, Inc. (AFMI)
BRC Group Holdings, Inc. (DRL)
BRC Group Holdings, Inc. (GRFPY)
BRC Group Holdings, Inc. (IGOT)
BRC Group Holdings, Inc. (ATLC)
|
|
Industry / Sector / Ticker Info
Analyst Coverage: No
Industry Group: FIN-MISC SVCS
Sector: Finance
CUSIP: 05580M108
SIC: 6282
|
|
Fiscal Year
Fiscal Year End: December
Last Reported Quarter: 09/01/25
Next Expected EPS Date: 08/12/26
|
|
Share - Related Items
Shares Outstanding: 31.22
Most Recent Split Date: 6.00 (0.05:1)
Beta: 1.27
Market Capitalization: $212.91 (millions)
|
|
|
|
|
| |
| • EPS Information |
• Dividend Information |
| Analyst Coverage: No |
Dividend Yield: 0.00% |
| Current Fiscal Quarter EPS Consensus Estimate: $ |
Indicated Annual Dividend: $0.00 |
| Current Fiscal Year EPS Consensus Estimate: $ |
Payout Ratio: |
| Number of Estimates in the Fiscal Year Consensus: |
Change In Payout Ratio: |
| Estmated Long-Term EPS Growth Rate: % |
Last Dividend Paid: NA - $0.00 |
| Next EPS Report Date: 08/12/26 |
|
|
|
| |