| Zacks Company Profile for RTX Corporation (RTX : NYSE) |
|
|
| |
| • Company Description |
| RTX Corporation is an aerospace and defense company. Its operating segments include Collins Aerospace, Pratt & Whitney, Raytheon Intelligence & Space, and Raytheon Missiles & Defense. RTX Corporation, formerly known as Raytheon Technologies Corporation, is headquartered in Arlington, Virginia.
Number of Employees: 186,000 |
|
|
| |
| • Price / Volume Information |
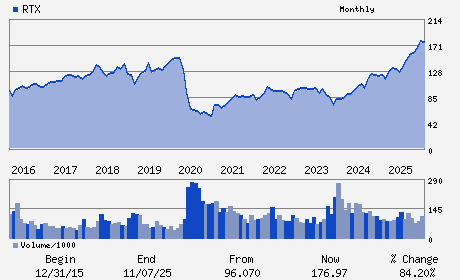
| Yesterday's Closing Price: $200.06 |
Daily Weekly Monthly
 |
| 20 Day Moving Average: 6,245,192 shares |
| Shares Outstanding: 1,342.29 (millions) |
| Market Capitalization: $268,538.12 (millions) |
| Beta: 0.43 |
| 52 Week High: $206.48 |
| 52 Week Low: $112.27 |
| Short Interest Ratio: |
| |
% Price Change |
% Price Change Relative to S&P 500 |
| 4 Week |
0.12% |
1.70% |
| 12 Week |
15.82% |
10.78% |
| Year To Date |
9.08% |
9.88% |
|
|
|
|
| |
| • Address & Contact Information |
| Street Address |
Phone / Fax |
Email Address |
Web URL |
1000 Wilson Boulevard
-
Arlington,VA 22209
USA |
ph: 781-522-3000
fax: 860-728-7028 |
investors@rtx.com |
http://www.rtx.com |
|
|
| |
| • General Corporate Information |
Officers
Christopher T. Calio - Chairman and Chief Executive Officer
Neil G. Mitchill - Executive Vice President and Chief Financial Offi
Ramsaran Maharajh - Executive Vice President and General Counsel
Amy L. Johnson - Senior Vice President; Controller
Dantaya M. Williams - Executive Vice President & Chief Human Resources O
|
|
Peer Information
RTX Corporation (BA)
RTX Corporation (HOVR)
RTX Corporation (HWM)
RTX Corporation (LMT)
RTX Corporation (TOD)
RTX Corporation (TXT)
|
|
Industry / Sector / Ticker Info
Analyst Coverage: No
Industry Group: AEROSP/DEFENSE
Sector: Aerospace
CUSIP: 75513E101
SIC: 3724
|
|
Fiscal Year
Fiscal Year End: December
Last Reported Quarter: 12/01/25
Next Expected EPS Date: 04/28/26
|
|
Share - Related Items
Shares Outstanding: 1,342.29
Most Recent Split Date: 6.00 (2.00:1)
Beta: 0.43
Market Capitalization: $268,538.12 (millions)
|
|
|
|
|
| |
| • EPS Information |
• Dividend Information |
| Analyst Coverage: No |
Dividend Yield: 1.36% |
| Current Fiscal Quarter EPS Consensus Estimate: $1.51 |
Indicated Annual Dividend: $2.72 |
| Current Fiscal Year EPS Consensus Estimate: $6.81 |
Payout Ratio: 0.43 |
| Number of Estimates in the Fiscal Year Consensus: 7.00 |
Change In Payout Ratio: -0.05 |
| Estmated Long-Term EPS Growth Rate: 10.16% |
Last Dividend Paid: 11/21/2025 - $0.68 |
| Next EPS Report Date: 04/28/26 |
|
|
|
| |