| Zacks Company Profile for Seven Arts Entertainment Inc. (SAPX : OTC) |
|
|
| |
| • Company Description |
| Seven Arts Entertainment, Inc. is an independent motion picture production company engaged in developing, financing, producing and licensing theatrical motion pictures. The movies are distributed for theatrical exhibition in the United States and Canada and other theatrical markets. The Company also provides its motion pictures in other forms of media, including DVD, home video, pay-per-view, and free television. Seven Arts Entertainment Inc., formally known as Seven Arts Pictures Plc., is based in London, the United Kingdom.
Number of Employees: 8 |
|
|
| |
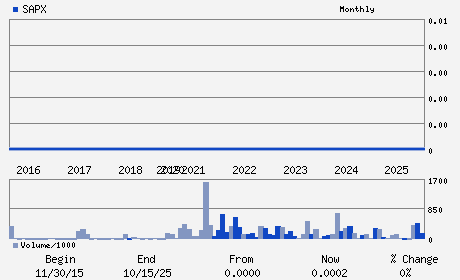
| • Price / Volume Information |
| Yesterday's Closing Price: $0.00 |
Daily Weekly Monthly
 |
| 20 Day Moving Average: 30,000 shares |
| Shares Outstanding: 2,681.42 (millions) |
| Market Capitalization: $0.27 (millions) |
| Beta: 2.85 |
| 52 Week High: $0.00 |
| 52 Week Low: $0.00 |
| Short Interest Ratio: |
| |
% Price Change |
% Price Change Relative to S&P 500 |
| 4 Week |
% |
% |
| 12 Week |
% |
% |
| Year To Date |
% |
% |
|
|
|
|
| |
| • Address & Contact Information |
| Street Address |
Phone / Fax |
Email Address |
Web URL |
3440 OAKCLIFF ROAD SUITE 104
-
ATLANTA,CA 30340
USA |
ph: 770-866-6250
fax: - |
None |
http://www.sevenartsentertainment.com |
|
|
| |
| • General Corporate Information |
Officers
Jason Black - Chief executive officer and Director
Thom Hazaert - Director
Robert Riggs - Directors
Candace Wernick - C.F.O
Anthony Hickox - Director
|
|
Peer Information
- (-)
- (-)
- (-)
- (-)
- (-)
- (-)
|
|
Industry / Sector / Ticker Info
Analyst Coverage: No
Industry Group: MOVIE/TV PRD&DIST
Sector: Consumer Discretionary
CUSIP: 81783N508
SIC: 7812
|
|
Fiscal Year
Fiscal Year End: June
Last Reported Quarter: 03/01/25
Next Expected EPS Date: 02/25/26
|
|
Share - Related Items
Shares Outstanding: 2,681.42
Most Recent Split Date: 2.00 (0.01:1)
Beta: 2.85
Market Capitalization: $0.27 (millions)
|
|
|
|
|
| |
| • EPS Information |
• Dividend Information |
| Analyst Coverage: No |
Dividend Yield: 0.00% |
| Current Fiscal Quarter EPS Consensus Estimate: $ |
Indicated Annual Dividend: $0.00 |
| Current Fiscal Year EPS Consensus Estimate: $ |
Payout Ratio: |
| Number of Estimates in the Fiscal Year Consensus: |
Change In Payout Ratio: |
| Estmated Long-Term EPS Growth Rate: % |
Last Dividend Paid: NA - $0.00 |
| Next EPS Report Date: 02/25/26 |
|
|
|
| |