| Zacks Company Profile for Simulations Plus, Inc. (SLP : NSDQ) |
|
|
| |
| • Company Description |
| Simulations Plus, Inc., is a premier developer of groundbreaking drug discovery and development simulation software, which is licensed to and used in the conduct of drug research by major pharmaceutical and biotechnology companies worldwide. They have two other businesses, Words+, Inc. and FutureLab, which are based on its proprietary software technologies.
Number of Employees: 213 |
|
|
| |
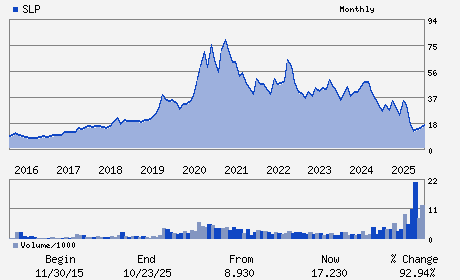
| • Price / Volume Information |
| Yesterday's Closing Price: $12.29 |
Daily Weekly Monthly
 |
| 20 Day Moving Average: 379,874 shares |
| Shares Outstanding: 20.15 (millions) |
| Market Capitalization: $247.61 (millions) |
| Beta: 1.12 |
| 52 Week High: $37.67 |
| 52 Week Low: $12.00 |
| Short Interest Ratio: |
| |
% Price Change |
% Price Change Relative to S&P 500 |
| 4 Week |
-39.34% |
-38.38% |
| 12 Week |
-26.32% |
-29.52% |
| Year To Date |
-32.58% |
-33.45% |
|
|
|
|
| |
|
|
| |
| • General Corporate Information |
Officers
Shawn O'Connor - Chief Executive Officer
Dr. Daniel Weiner - Chairman of the Board of Directors
Will Frederick - Chief Financial Officer and Executive Vice Presid
Walter S. Woltosz - Director
Dr. Lisa LaVange - Director
|
|
Peer Information
Simulations Plus, Inc. (ATEA)
Simulations Plus, Inc. (BITS.)
Simulations Plus, Inc. (DCTM)
Simulations Plus, Inc. (DLVAZ)
Simulations Plus, Inc. (DOCC)
Simulations Plus, Inc. (NEON)
|
|
Industry / Sector / Ticker Info
Analyst Coverage: No
Industry Group: COMP-SOFTWARE
Sector: Computer and Technology
CUSIP: 829214105
SIC: 7373
|
|
Fiscal Year
Fiscal Year End: August
Last Reported Quarter: 11/01/25
Next Expected EPS Date: 04/02/26
|
|
Share - Related Items
Shares Outstanding: 20.15
Most Recent Split Date: 10.00 (2.00:1)
Beta: 1.12
Market Capitalization: $247.61 (millions)
|
|
|
|
|
| |
| • EPS Information |
• Dividend Information |
| Analyst Coverage: No |
Dividend Yield: 0.00% |
| Current Fiscal Quarter EPS Consensus Estimate: $0.27 |
Indicated Annual Dividend: $0.00 |
| Current Fiscal Year EPS Consensus Estimate: $1.03 |
Payout Ratio: 0.00 |
| Number of Estimates in the Fiscal Year Consensus: 1.00 |
Change In Payout Ratio: -0.29 |
| Estmated Long-Term EPS Growth Rate: % |
Last Dividend Paid: NA - $0.00 |
| Next EPS Report Date: 04/02/26 |
|
|
|
| |