| Zacks Company Profile for SoFi Technologies, Inc. (SOFI : NSDQ) |
|
|
| |
| • Company Description |
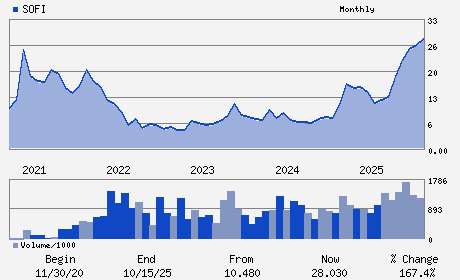
| SoFi Technologies Inc. provides consumer-focused financial technology platform. SoFi Technologies Inc., formerly known as Social Capital Hedosophia Holdings Corp. V, is based in PALO ALTO, Calif.
Number of Employees: 5,000 |
|
|
| |
| • Price / Volume Information |
| Yesterday's Closing Price: $19.61 |
Daily Weekly Monthly
 |
| 20 Day Moving Average: 57,814,184 shares |
| Shares Outstanding: 1,205.90 (millions) |
| Market Capitalization: $23,647.76 (millions) |
| Beta: 2.13 |
| 52 Week High: $32.73 |
| 52 Week Low: $8.60 |
| Short Interest Ratio: |
| |
% Price Change |
% Price Change Relative to S&P 500 |
| 4 Week |
-24.95% |
-23.81% |
| 12 Week |
-22.15% |
-24.81% |
| Year To Date |
-25.09% |
-24.99% |
|
|
|
|
| |
| • Address & Contact Information |
| Street Address |
Phone / Fax |
Email Address |
Web URL |
234 1ST STREET
-
SAN FRANCISCO,CA 94105
USA |
ph: 855-456-7634
fax: - |
ir@sofi.com |
http://www.sofi.com |
|
|
| |
| • General Corporate Information |
Officers
Anthony Noto - Chief Executive Officer
Tom Hutton - Chairman of the Board of Directors
Steven Freiberg - Vice Chairman of the Board of Directors
Christopher Lapointe - Chief Financial Officer
Ruzwana Bashir - Director
|
|
Peer Information
SoFi Technologies, Inc. (EIIN)
SoFi Technologies, Inc. (AFMI)
SoFi Technologies, Inc. (DRL)
SoFi Technologies, Inc. (GRFPY)
SoFi Technologies, Inc. (IGOT)
SoFi Technologies, Inc. (ATLC)
|
|
Industry / Sector / Ticker Info
Analyst Coverage: No
Industry Group: FIN-MISC SVCS
Sector: Finance
CUSIP: 83406F102
SIC: 6199
|
|
Fiscal Year
Fiscal Year End: December
Last Reported Quarter: 12/01/25
Next Expected EPS Date: 05/05/26
|
|
Share - Related Items
Shares Outstanding: 1,205.90
Most Recent Split Date: (:1)
Beta: 2.13
Market Capitalization: $23,647.76 (millions)
|
|
|
|
|
| |
| • EPS Information |
• Dividend Information |
| Analyst Coverage: No |
Dividend Yield: 0.00% |
| Current Fiscal Quarter EPS Consensus Estimate: $0.12 |
Indicated Annual Dividend: $0.00 |
| Current Fiscal Year EPS Consensus Estimate: $0.61 |
Payout Ratio: 0.00 |
| Number of Estimates in the Fiscal Year Consensus: 6.00 |
Change In Payout Ratio: |
| Estmated Long-Term EPS Growth Rate: % |
Last Dividend Paid: NA - $0.00 |
| Next EPS Report Date: 05/05/26 |
|
|
|
| |