| Zacks Company Profile for Tilray Brands, Inc. (TLRY : NSDQ) |
|
|
| |
| • Company Description |
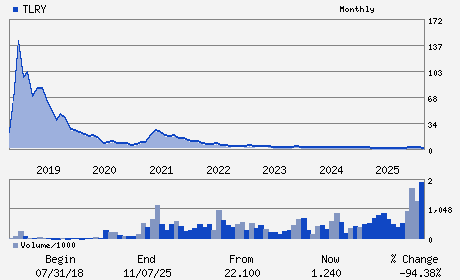
| Tilray Brands Inc. is a cannabis-lifestyle and consumer packaged goods company. It operates principally in Canada, the United States, Europe, Australia and Latin America. Tilray Brands Inc., formerly known as Tilray Inc., is based in NEW YORK.
Number of Employees: 2,842 |
|
|
| |
| • Price / Volume Information |
| Yesterday's Closing Price: $7.51 |
Daily Weekly Monthly
 |
| 20 Day Moving Average: 3,285,650 shares |
| Shares Outstanding: 116.51 (millions) |
| Market Capitalization: $874.97 (millions) |
| Beta: 2.02 |
| 52 Week High: $23.20 |
| 52 Week Low: $3.51 |
| Short Interest Ratio: |
| |
% Price Change |
% Price Change Relative to S&P 500 |
| 4 Week |
-22.66% |
-21.43% |
| 12 Week |
-16.47% |
-20.11% |
| Year To Date |
-16.83% |
-16.90% |
|
|
|
|
| |
|
|
| |
| • General Corporate Information |
Officers
Irwin D. Simon - Chief Executive Officer and Chairman
Carl Merton - Chief Financial Officer
Renah Persofsky - Director
Steven Cohen - Director
David Clanachan - Director
|
|
Peer Information
Tilray Brands, Inc. (BJCT)
Tilray Brands, Inc. (CADMQ)
Tilray Brands, Inc. (APNO)
Tilray Brands, Inc. (UPDC)
Tilray Brands, Inc. (IMTIQ)
Tilray Brands, Inc. (CYGN)
|
|
Industry / Sector / Ticker Info
Analyst Coverage: No
Industry Group: MED PRODUCTS
Sector: Medical
CUSIP: 88688T209
SIC: 2833
|
|
Fiscal Year
Fiscal Year End: May
Last Reported Quarter: 11/01/25
Next Expected EPS Date: 04/14/26
|
|
Share - Related Items
Shares Outstanding: 116.51
Most Recent Split Date: 12.00 (0.10:1)
Beta: 2.02
Market Capitalization: $874.97 (millions)
|
|
|
|
|
| |
| • EPS Information |
• Dividend Information |
| Analyst Coverage: No |
Dividend Yield: 0.00% |
| Current Fiscal Quarter EPS Consensus Estimate: $-0.14 |
Indicated Annual Dividend: $0.00 |
| Current Fiscal Year EPS Consensus Estimate: $-0.56 |
Payout Ratio: |
| Number of Estimates in the Fiscal Year Consensus: 5.00 |
Change In Payout Ratio: |
| Estmated Long-Term EPS Growth Rate: % |
Last Dividend Paid: NA - $0.00 |
| Next EPS Report Date: 04/14/26 |
|
|
|
| |