| Zacks Company Profile for TSS Inc. (TSSI : NSDQ) |
|
|
| |
| • Company Description |
| TSS, Inc. offers planning, design, engineering, construction management, commissioning and maintenance services. It provides these services primarily for specialized facilities such as data centers, communications rooms, call centers, laboratories, trading floors, network operations centers, medical facilities and similar environments. TSS Inc., formerly known as Fortress International Group, Inc., is based in Columbia, United States.
Number of Employees: 161 |
|
|
| |
| • Price / Volume Information |
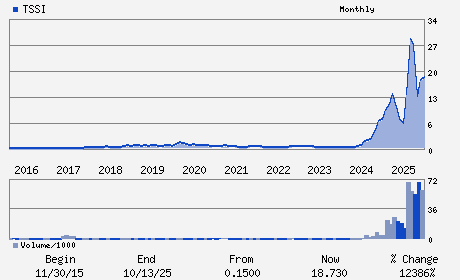
| Yesterday's Closing Price: $8.14 |
Daily Weekly Monthly
 |
| 20 Day Moving Average: 1,016,114 shares |
| Shares Outstanding: 28.84 (millions) |
| Market Capitalization: $234.80 (millions) |
| Beta: 2.07 |
| 52 Week High: $31.94 |
| 52 Week Low: $5.63 |
| Short Interest Ratio: |
| |
% Price Change |
% Price Change Relative to S&P 500 |
| 4 Week |
-32.45% |
-31.42% |
| 12 Week |
5.03% |
1.45% |
| Year To Date |
15.13% |
15.29% |
|
|
|
|
| |
| • Address & Contact Information |
| Street Address |
Phone / Fax |
Email Address |
Web URL |
1800 Aviation Drive Building 1 Suite 100
-
Georgetown,TX 78628
USA |
ph: 512-310-1000
fax: 302-636-5454 |
tssi@haydenir.com |
https://tssiusa.com |
|
|
| |
| • General Corporate Information |
Officers
Darryll Dewan - Chief Executive Officer
Peter H. Woodward - Chairman
Daniel M. Chism - Chief Financial Officer
Richard M. Metzler - Director
Michael J. Fahy - Director
|
|
Peer Information
TSS Inc. (TURN)
TSS Inc. (FWLT)
TSS Inc. (CTAK)
TSS Inc. (AVNA)
TSS Inc. (NLX.)
TSS Inc. (T.AGR)
|
|
Industry / Sector / Ticker Info
Analyst Coverage: No
Industry Group: ENGINRG/R&D SVS
Sector: Construction
CUSIP: 87288V101
SIC: 8742
|
|
Fiscal Year
Fiscal Year End: December
Last Reported Quarter: 09/01/25
Next Expected EPS Date: 03/26/26
|
|
Share - Related Items
Shares Outstanding: 28.84
Most Recent Split Date: (:1)
Beta: 2.07
Market Capitalization: $234.80 (millions)
|
|
|
|
|
| |
| • EPS Information |
• Dividend Information |
| Analyst Coverage: No |
Dividend Yield: 0.00% |
| Current Fiscal Quarter EPS Consensus Estimate: $ |
Indicated Annual Dividend: $0.00 |
| Current Fiscal Year EPS Consensus Estimate: $ |
Payout Ratio: 0.00 |
| Number of Estimates in the Fiscal Year Consensus: |
Change In Payout Ratio: 0.00 |
| Estmated Long-Term EPS Growth Rate: % |
Last Dividend Paid: NA - $0.00 |
| Next EPS Report Date: 03/26/26 |
|
|
|
| |