| Zacks Company Profile for TDK Corp. (TTDKY : OTC) |
|
|
| |
| • Company Description |
| TDK Corp. has a portfolio of technologies originally developed for its businesses involving electronic materials, components and devices, semiconductor, recording media and data storage devices. Its technical leadership includes materials research and development for dielectric, organic and semiconductor materials, process technologies for thick and thin film, metal, semiconductors and integration technologies. TDK technologies can be found in multimedia, video, television, personal computers, mobile communications, and semiconductors. (PRESS RELEASE)
Number of Employees: 105,067 |
|
|
| |
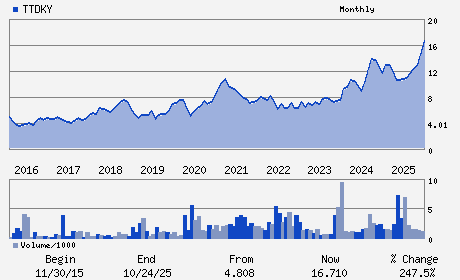
| • Price / Volume Information |
| Yesterday's Closing Price: $14.72 |
Daily Weekly Monthly
 |
| 20 Day Moving Average: 250,530 shares |
| Shares Outstanding: 1,943.86 (millions) |
| Market Capitalization: $28,613.60 (millions) |
| Beta: 0.78 |
| 52 Week High: $18.51 |
| 52 Week Low: $8.11 |
| Short Interest Ratio: |
| |
% Price Change |
% Price Change Relative to S&P 500 |
| 4 Week |
12.19% |
13.90% |
| 12 Week |
-5.64% |
-8.86% |
| Year To Date |
4.40% |
4.54% |
|
|
|
|
| |
| • Address & Contact Information |
| Street Address |
Phone / Fax |
Email Address |
Web URL |
Nihonbashi Takashimaya Mitsui Building 2-5-1 Nihonbashi Chuo-ku
-
Tokyo,M0 103-6128
JPN |
ph: 813-6778-1068
fax: - |
None |
http://www.tdk.com |
|
|
| |
| • General Corporate Information |
Officers
Noboru Saito - Chief Executive Officer and President
Mutsuo Iwai - Chairman
Tetsuji Yamanishi - Senior Vice President
Kozue Nakayama - Director
Shoei Yamana - Director
|
|
Peer Information
TDK Corp. (SMTI.)
TDK Corp. (DDICQ)
TDK Corp. (CGGIQ)
TDK Corp. (CRDN)
TDK Corp. (CDTS)
TDK Corp. (AURAQ)
|
|
Industry / Sector / Ticker Info
Analyst Coverage: No
Industry Group: ELEC-MISC COMPONENTS
Sector: Computer and Technology
CUSIP: 872351408
SIC: 3695
|
|
Fiscal Year
Fiscal Year End: March
Last Reported Quarter: 12/01/25
Next Expected EPS Date: 04/27/26
|
|
Share - Related Items
Shares Outstanding: 1,943.86
Most Recent Split Date: 10.00 (5.00:1)
Beta: 0.78
Market Capitalization: $28,613.60 (millions)
|
|
|
|
|
| |
| • EPS Information |
• Dividend Information |
| Analyst Coverage: No |
Dividend Yield: 0.84% |
| Current Fiscal Quarter EPS Consensus Estimate: $ |
Indicated Annual Dividend: $0.12 |
| Current Fiscal Year EPS Consensus Estimate: $0.65 |
Payout Ratio: 0.19 |
| Number of Estimates in the Fiscal Year Consensus: 1.00 |
Change In Payout Ratio: -0.04 |
| Estmated Long-Term EPS Growth Rate: 17.53% |
Last Dividend Paid: NA - $0.00 |
| Next EPS Report Date: 04/27/26 |
|
|
|
| |