| Zacks Company Profile for Under Armour, Inc. (UA : NYSE) |
|
|
| |
| • Company Description |
| Under Armour, Inc. is involved in the development, marketing and distribution of branded performance apparel, footwear and accessories for men, women and youth. It operates primarily in North America, Europe, the Middle East, Africa, the Asia-Pacific and Latin America. The company's Under Armour Connected Fitness(TM) platform provides digital health and fitness community through UA Record, MapMyFitness, Endomondo and MyFitnessPal applications. Under Armour, Inc. is headquartered in Baltimore, Maryland.
Number of Employees: |
|
|
| |
| • Price / Volume Information |
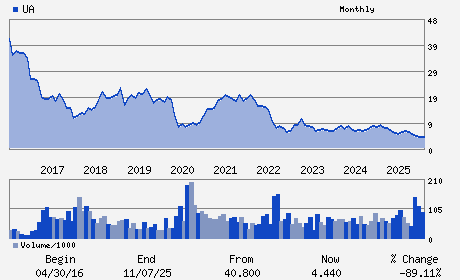
| Yesterday's Closing Price: $6.97 |
Daily Weekly Monthly
 |
| 20 Day Moving Average: 6,562,142 shares |
| Shares Outstanding: 425.89 (millions) |
| Market Capitalization: $2,968.45 (millions) |
| Beta: 1.74 |
| 52 Week High: $7.70 |
| 52 Week Low: $3.95 |
| Short Interest Ratio: |
| |
% Price Change |
% Price Change Relative to S&P 500 |
| 4 Week |
22.50% |
24.36% |
| 12 Week |
70.42% |
64.60% |
| Year To Date |
45.21% |
45.41% |
|
|
|
|
| |
|
|
| |
| • General Corporate Information |
Officers
Kevin A. Plank - Chief Executive Officer and President
Mohamed A. El-Erian - Chairman
David E. Bergman - Chief Financial Officer
Eric J. Aumen - Chief Accounting Officer
Douglas E. Coltharp - Director
|
|
Peer Information
Under Armour, Inc. (DLWI)
Under Armour, Inc. (DNKYQ)
Under Armour, Inc. (CYDS)
Under Armour, Inc. (GOSHA)
Under Armour, Inc. (JLMCQ)
Under Armour, Inc. (FUNW)
|
|
Industry / Sector / Ticker Info
Analyst Coverage: No
Industry Group: TEXTILE-APPAREL
Sector: Consumer Discretionary
CUSIP: 904311206
SIC: 5611
|
|
Fiscal Year
Fiscal Year End: March
Last Reported Quarter: 12/01/25
Next Expected EPS Date: 05/12/26
|
|
Share - Related Items
Shares Outstanding: 425.89
Most Recent Split Date: (:1)
Beta: 1.74
Market Capitalization: $2,968.45 (millions)
|
|
|
|
|
| |
| • EPS Information |
• Dividend Information |
| Analyst Coverage: No |
Dividend Yield: 0.00% |
| Current Fiscal Quarter EPS Consensus Estimate: $ |
Indicated Annual Dividend: $0.00 |
| Current Fiscal Year EPS Consensus Estimate: $ |
Payout Ratio: 0.00 |
| Number of Estimates in the Fiscal Year Consensus: |
Change In Payout Ratio: 0.00 |
| Estmated Long-Term EPS Growth Rate: % |
Last Dividend Paid: NA - $0.00 |
| Next EPS Report Date: 05/12/26 |
|
|
|
| |