| Zacks Company Profile for UbiSoft Entertainment Inc. (UBSFY : OTC) |
|
|
| |
| • Company Description |
| Ubisoft Entertainment operates in parts of Europe, Canada and the United States and its primary activities are the production, publishing and distribution of interactive entertainment products. Products include video games, educational and cultural software, cartoons, literary, multimedia, audio-visual products, cinematographic and television works. Some of its brands are Driver, Anno, Endwar and Tom Clancy.
Number of Employees: 17,782 |
|
|
| |
| • Price / Volume Information |
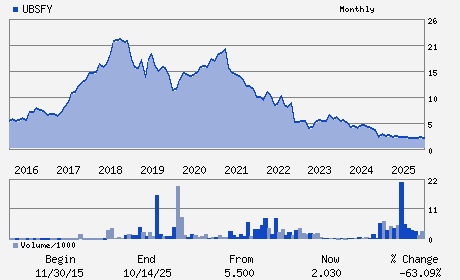
| Yesterday's Closing Price: $1.04 |
Daily Weekly Monthly
 |
| 20 Day Moving Average: 547,458 shares |
| Shares Outstanding: 673.60 (millions) |
| Market Capitalization: $700.55 (millions) |
| Beta: -0.14 |
| 52 Week High: $3.35 |
| 52 Week Low: $0.90 |
| Short Interest Ratio: |
| |
% Price Change |
% Price Change Relative to S&P 500 |
| 4 Week |
-32.47% |
-31.44% |
| 12 Week |
-36.20% |
-38.37% |
| Year To Date |
-28.28% |
-28.18% |
|
|
|
|
| |
| • Address & Contact Information |
| Street Address |
Phone / Fax |
Email Address |
Web URL |
2 Rue Du Chene Heleuc
-
Carentoir Cedex 2,I0 56910
FRA |
ph: 33-01-48-18-50-00
fax: 33-01-48-57-07-41 |
ir@ubisoft.fr |
http://www.ubisoft.com |
|
|
| |
| • General Corporate Information |
Officers
Yves Guillemot - Chairman and Chief Executive Officer
Cecile Russeil - Executive Vice President
Olfa Zorgati - Director
Katherine Hays - Director
Claude France - Director
|
|
Peer Information
UbiSoft Entertainment Inc. (CHLD.)
UbiSoft Entertainment Inc. (FGRD)
UbiSoft Entertainment Inc. (CGMI.)
UbiSoft Entertainment Inc. (AGAM.)
UbiSoft Entertainment Inc. (ASCA.)
UbiSoft Entertainment Inc. (BYD)
|
|
Industry / Sector / Ticker Info
Analyst Coverage: No
Industry Group: GAMING
Sector: Consumer Discretionary
CUSIP: 90348R102
SIC: 7372
|
|
Fiscal Year
Fiscal Year End: March
Last Reported Quarter: -
Next Expected EPS Date: -
|
|
Share - Related Items
Shares Outstanding: 673.60
Most Recent Split Date: (:1)
Beta: -0.14
Market Capitalization: $700.55 (millions)
|
|
|
|
|
| |
| • EPS Information |
• Dividend Information |
| Analyst Coverage: No |
Dividend Yield: 0.00% |
| Current Fiscal Quarter EPS Consensus Estimate: $ |
Indicated Annual Dividend: $0.00 |
| Current Fiscal Year EPS Consensus Estimate: $-0.94 |
Payout Ratio: |
| Number of Estimates in the Fiscal Year Consensus: 2.00 |
Change In Payout Ratio: |
| Estmated Long-Term EPS Growth Rate: % |
Last Dividend Paid: NA - $0.00 |
| Next EPS Report Date: - |
|
|
|
| |