| Zacks Company Profile for Vital Farms, Inc. (VITL : NSDQ) |
|
|
| |
| • Company Description |
| Vital Farms Inc. offers a range of produced pasture-raised foods. Its product, including shell eggs, butter, hard-boiled eggs, ghee and liquid whole eggs. Vital Farms Inc. is based in AUSTIN, Texas.
Number of Employees: 598 |
|
|
| |
| • Price / Volume Information |
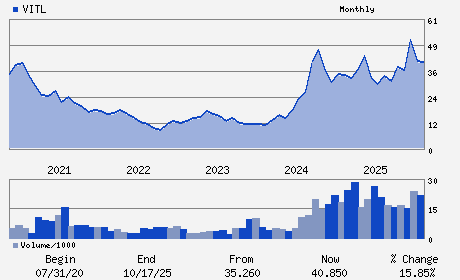
| Yesterday's Closing Price: $28.41 |
Daily Weekly Monthly
 |
| 20 Day Moving Average: 1,614,657 shares |
| Shares Outstanding: 44.78 (millions) |
| Market Capitalization: $1,272.04 (millions) |
| Beta: 1.10 |
| 52 Week High: $53.13 |
| 52 Week Low: $25.51 |
| Short Interest Ratio: |
| |
% Price Change |
% Price Change Relative to S&P 500 |
| 4 Week |
-2.87% |
-1.40% |
| 12 Week |
-11.39% |
-14.41% |
| Year To Date |
-11.05% |
-10.93% |
|
|
|
|
| |
|
|
| |
| • General Corporate Information |
Officers
Russell Diez-Canseco - President and Chief Executive Officer
Matthew O'Hayer - Executive Chairperson and Director
Thilo Wrede - Chief Financial Officer
Kofi Amoo-Gottfried - Director
Glenda Flanagan - Director
|
|
Peer Information
Vital Farms, Inc. (CDSCY)
Vital Farms, Inc. (HDNHY)
Vital Farms, Inc. (CPB)
Vital Farms, Inc. (AMNF)
Vital Farms, Inc. (GMFIY)
Vital Farms, Inc. (BRID)
|
|
Industry / Sector / Ticker Info
Analyst Coverage: No
Industry Group: FOOD-MISC/DIVERSIFIED
Sector: Consumer Staples
CUSIP: 92847W103
SIC: 2000
|
|
Fiscal Year
Fiscal Year End: December
Last Reported Quarter: 09/01/25
Next Expected EPS Date: 02/26/26
|
|
Share - Related Items
Shares Outstanding: 44.78
Most Recent Split Date: (:1)
Beta: 1.10
Market Capitalization: $1,272.04 (millions)
|
|
|
|
|
| |
| • EPS Information |
• Dividend Information |
| Analyst Coverage: No |
Dividend Yield: 0.00% |
| Current Fiscal Quarter EPS Consensus Estimate: $0.41 |
Indicated Annual Dividend: $0.00 |
| Current Fiscal Year EPS Consensus Estimate: $1.64 |
Payout Ratio: 0.00 |
| Number of Estimates in the Fiscal Year Consensus: 5.00 |
Change In Payout Ratio: 0.00 |
| Estmated Long-Term EPS Growth Rate: % |
Last Dividend Paid: NA - $0.00 |
| Next EPS Report Date: 02/26/26 |
|
|
|
| |