| Zacks Company Profile for Village Super Market, Inc. (VLGEA : NSDQ) |
|
|
| |
| • Company Description |
| VILLAGE SUPER MARKET, INC. operates a chain of 21 ShopRite supermarkets, 15 of which are located in northern New Jersey, 1 in northeastern Pennsylvania and 5 in the southern shore area of New Jersey. In addition, Co. operates two Village Market stores.
Number of Employees: 7,200 |
|
|
| |
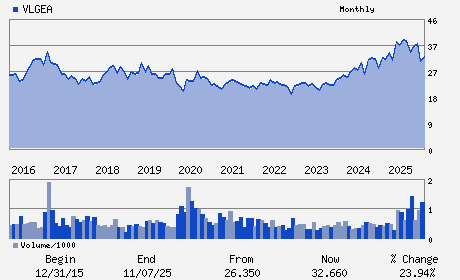
| • Price / Volume Information |
| Yesterday's Closing Price: $39.70 |
Daily Weekly Monthly
 |
| 20 Day Moving Average: 49,502 shares |
| Shares Outstanding: 14.75 (millions) |
| Market Capitalization: $585.71 (millions) |
| Beta: 0.52 |
| 52 Week High: $40.15 |
| 52 Week Low: $30.08 |
| Short Interest Ratio: |
| |
% Price Change |
% Price Change Relative to S&P 500 |
| 4 Week |
11.11% |
12.80% |
| 12 Week |
15.74% |
11.80% |
| Year To Date |
12.16% |
12.32% |
|
|
|
|
| |
|
|
| |
| • General Corporate Information |
Officers
John J. Sumas - Chief Executive Officer
John Van Orden - Chief Financial Officer
Robert P. Sumas - Director
Steven Crystal - Director
John P. Sumas - Director
|
|
Peer Information
Village Super Market, Inc. (DYSVY)
Village Super Market, Inc. (IFMK)
Village Super Market, Inc. (BSDNF)
Village Super Market, Inc. (GAPTQ)
Village Super Market, Inc. (DEG)
Village Super Market, Inc. (GUCO)
|
|
Industry / Sector / Ticker Info
Analyst Coverage: No
Industry Group: RETAIL-SUPERMKT
Sector: Retail/Wholesale
CUSIP: 927107409
SIC: 5411
|
|
Fiscal Year
Fiscal Year End: July
Last Reported Quarter: 10/01/25
Next Expected EPS Date: 03/03/26
|
|
Share - Related Items
Shares Outstanding: 14.75
Most Recent Split Date: 1.00 (2.00:1)
Beta: 0.52
Market Capitalization: $585.71 (millions)
|
|
|
|
|
| |
| • EPS Information |
• Dividend Information |
| Analyst Coverage: No |
Dividend Yield: 2.52% |
| Current Fiscal Quarter EPS Consensus Estimate: $ |
Indicated Annual Dividend: $1.00 |
| Current Fiscal Year EPS Consensus Estimate: $ |
Payout Ratio: 0.26 |
| Number of Estimates in the Fiscal Year Consensus: |
Change In Payout Ratio: -0.13 |
| Estmated Long-Term EPS Growth Rate: % |
Last Dividend Paid: 12/31/2025 - $0.25 |
| Next EPS Report Date: 03/03/26 |
|
|
|
| |