| Zacks Company Profile for XWELL, Inc. (XWEL : NSDQ) |
|
|
| |
| • Company Description |
| XWELL Inc. is a health and wellness holding company. Its operating brands include XpresCheck(R), XpresSpa(R), Treat(TM) and HyperPointe. XpresSpa is a retailer of wellness services and related products. Treat is a travel health and wellness brand. XpresCheck is a provider of Covid-19 screening and diagnostic testing in partnership with the CDC and Concentric by Ginkgo. HyperPointe is a digital healthcare and data analytics relationship company. XWELL Inc., formerly known as XpresSpa Group Inc., is based in NEW YORK.
Number of Employees: 312 |
|
|
| |
| • Price / Volume Information |
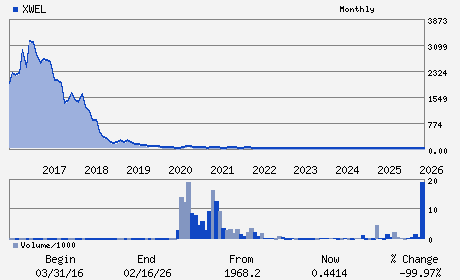
| Yesterday's Closing Price: $0.44 |
Daily Weekly Monthly
 |
| 20 Day Moving Average: 1,488,147 shares |
| Shares Outstanding: 5.77 (millions) |
| Market Capitalization: $2.55 (millions) |
| Beta: 1.51 |
| 52 Week High: $1.42 |
| 52 Week Low: $0.26 |
| Short Interest Ratio: |
| |
% Price Change |
% Price Change Relative to S&P 500 |
| 4 Week |
12.03% |
13.73% |
| 12 Week |
-41.15% |
-43.15% |
| Year To Date |
-4.21% |
-4.08% |
|
|
|
|
| |
| • Address & Contact Information |
| Street Address |
Phone / Fax |
Email Address |
Web URL |
254 WEST 31ST STREET 11TH FLOOR
-
NEW YORK,NY 10001
USA |
ph: 212-750-9595
fax: 309-410-3967 |
ir@xwell.com |
http://www.xwell.com |
|
|
| |
| • General Corporate Information |
Officers
Ezra T. Ernst - Chief Executive Officer and Director
Ian Brown - Chief Financial Officer
Bruce T. Bernstein - Director
Robert Weinstein - Director
Michael Lebowitz - Director
|
|
Peer Information
XWELL, Inc. (CHCR)
XWELL, Inc. (ESRX)
XWELL, Inc. (MYDP)
XWELL, Inc. (COR)
XWELL, Inc. (GBCS)
XWELL, Inc. (LAXAF)
|
|
Industry / Sector / Ticker Info
Analyst Coverage: No
Industry Group: Medical Services
Sector: Medical
CUSIP: 98420U802
SIC: 7200
|
|
Fiscal Year
Fiscal Year End: December
Last Reported Quarter: 09/01/25
Next Expected EPS Date: 04/21/26
|
|
Share - Related Items
Shares Outstanding: 5.77
Most Recent Split Date: 9.00 (0.05:1)
Beta: 1.51
Market Capitalization: $2.55 (millions)
|
|
|
|
|
| |
| • EPS Information |
• Dividend Information |
| Analyst Coverage: No |
Dividend Yield: 0.00% |
| Current Fiscal Quarter EPS Consensus Estimate: $ |
Indicated Annual Dividend: $0.00 |
| Current Fiscal Year EPS Consensus Estimate: $ |
Payout Ratio: |
| Number of Estimates in the Fiscal Year Consensus: |
Change In Payout Ratio: |
| Estmated Long-Term EPS Growth Rate: % |
Last Dividend Paid: NA - $0.00 |
| Next EPS Report Date: 04/21/26 |
|
|
|
| |