| Zacks Company Profile for Avantor, Inc. (AVTR : NYSE) |
|
|
| |
| • Company Description |
| Avantor Inc. is a provider of critical products and services primarily to biopharma, healthcare, education & government, advanced technologies & applied materials industries. Avantor Inc. is based in Radnor, United States.
Number of Employees: 13,500 |
|
|
| |
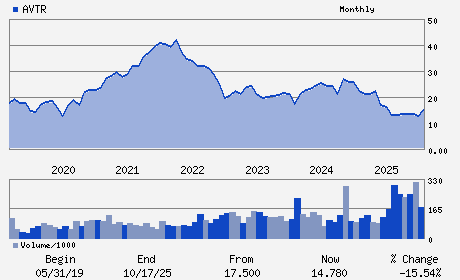
| • Price / Volume Information |
| Yesterday's Closing Price: $11.44 |
Daily Weekly Monthly
 |
| 20 Day Moving Average: 8,971,373 shares |
| Shares Outstanding: 682.76 (millions) |
| Market Capitalization: $7,810.72 (millions) |
| Beta: 0.94 |
| 52 Week High: $15.93 |
| 52 Week Low: $7.27 |
| Short Interest Ratio: |
| |
% Price Change |
% Price Change Relative to S&P 500 |
| 4 Week |
13.49% |
12.66% |
| 12 Week |
41.23% |
37.37% |
| Year To Date |
-0.17% |
-8.48% |
|
|
|
|
| |
|
|
| |
| • General Corporate Information |
Officers
Emmanuel Ligner - President and Chief Executive Officer
Greg Summe - Chairman of the Board of Directors
R. Brent Jones - Executive Vice President and Chief Financial Offic
Steven Eck - Senior Vice President and Chief Accounting Officer
Juan Andres - Director
|
|
Peer Information
Avantor, Inc. (CHCR)
Avantor, Inc. (ESRX)
Avantor, Inc. (MYDP)
Avantor, Inc. (COR)
Avantor, Inc. (GBCS)
Avantor, Inc. (LAXAF)
|
|
Industry / Sector / Ticker Info
Analyst Coverage: No
Industry Group: Medical Services
Sector: Medical
CUSIP: 05352A100
SIC: 3826
|
|
Fiscal Year
Fiscal Year End: December
Last Reported Quarter: 03/01/26
Next Expected EPS Date: 07/29/26
|
|
Share - Related Items
Shares Outstanding: 682.76
Most Recent Split Date: (:1)
Beta: 0.94
Market Capitalization: $7,810.72 (millions)
|
|
|
|
|
| |
| • EPS Information |
• Dividend Information |
| Analyst Coverage: No |
Dividend Yield: 0.00% |
| Current Fiscal Quarter EPS Consensus Estimate: $0.20 |
Indicated Annual Dividend: $0.00 |
| Current Fiscal Year EPS Consensus Estimate: $0.79 |
Payout Ratio: 0.00 |
| Number of Estimates in the Fiscal Year Consensus: 7.00 |
Change In Payout Ratio: 0.00 |
| Estmated Long-Term EPS Growth Rate: 2.28% |
Last Dividend Paid: NA - $0.00 |
| Next EPS Report Date: 07/29/26 |
|
|
|
| |